Looking for Visual Discovery Tools?
Good visual discovery tools enable users to make sense out of absolutely enormous amounts of data. InetSoft's software allows the kind of data exploration that would have taken hundreds of traditional reports and scorecards to be performed on a single, interactive dashboard.
With InetSoft's StyleBI, visual discovery can be done by end users with little to no training. When users have a business question, they won't need to ask a reporting analyst to go back and run queries on a database.
This kind of on the fly ad-hoc exploration also enables data exploration to be done in groups, so that in meetings, users can explore data relationships together.
When data relationships can be displayed visually, they make lasting impressions on the user.


How InetSoft's solution enables excellent visual discovery
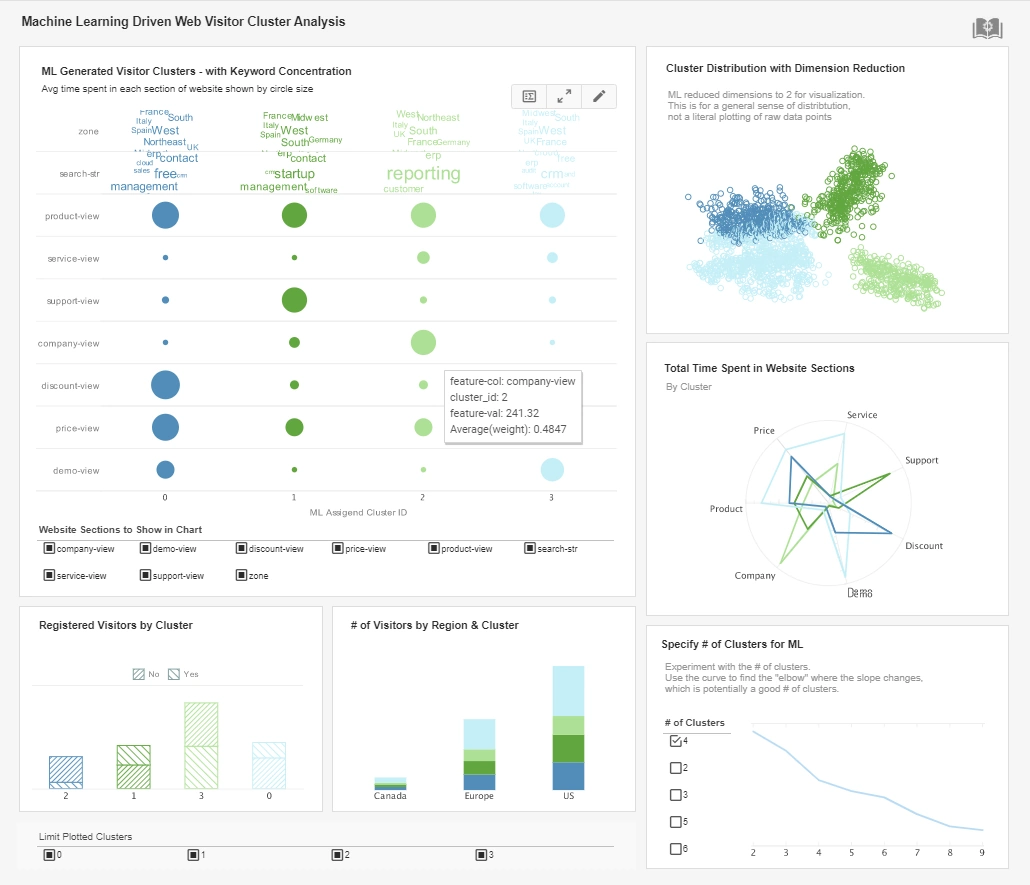
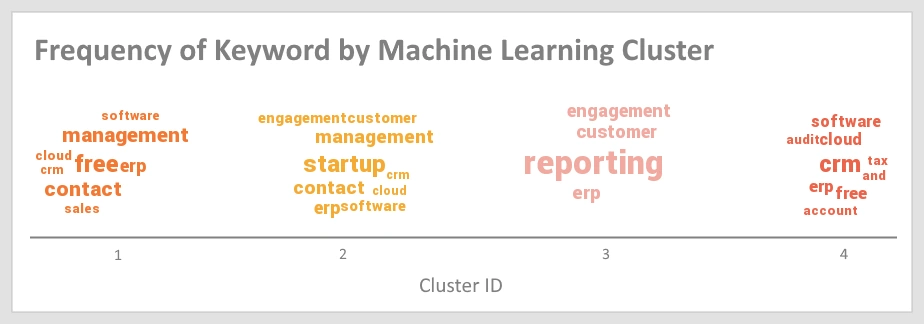
StyleBI has the visualization capabilities that make finding patterns in data easy. In addition to standard charting capabilities, chart elements can individually vary by size and color to communicate different attributes. These variable elements enable much more to be communicated visually than in a standard chart.
Brushing enables certain categories of data to be selectively visualized with the click of a mouse, for the easy recognition of meaningful patterns.
StyleBI's drill down capability makes a perfect complement to robust interactive visualization. The ability to drill down from a broad view to individual data examples increases the chance of discovering a meaningful pattern. Once a pattern is deduced, the hypothesis can be tested with more visual manipulations. With InetSoft's solution, you can move from broad view to specific cases with just a few clicks.
Why a Fisheries Byproduct Processor Replaced ThoughtSpot with InetSoft’s Serverless Visual Discovery
For a Fisheries Byproduct Processor—a mid-sized company that turns fish waste into fishmeal, oils, collagen and specialty bioproducts—the analytics problem is both specific and surprisingly broad. Data lands from processing lines (yields, weights, temperatures), supply-chain feeds (vessel manifests, catch certifications), purchases (raw material lots), and compliance systems (traceability, export documentation). The organization I’m describing recently moved its analytics and ad-hoc discovery workload from ThoughtSpot to InetSoft’s serverless visual discovery offering. The decision was pragmatic: reduce license and infrastructure cost, collapse administrative overhead, and provide a responsive experience for managers and line-level users who need fast, self-service insight without becoming BI engineers.
Licensing: moving away from per-seat / consumption complexity
ThoughtSpot’s licensing model combines per-user tiers and increasingly popular consumption/credit models. For organizations with lots of occasional users or heavy automated query patterns, that billing complexity translates into unpredictability and often higher effective spend as queries and data volumes grow. ThoughtSpot documents both named/per-user and consumption/credit licensing options, meaning total cost can depend heavily on query volume, cluster size, and the deployment footprint. :contentReference[oaicite:0]{index=0}
InetSoft’s entry pricing and packaging for Style Intelligence / StyleBI is much more straightforward; it historically targets modest entry-points (developer packs and small user packs) and offers perpetual and subscription choices that IT teams can map to concurrent users or small packs rather than atomized per-query credits. That predictability was a major factor for the fisheries processor: their day-to-day user base was a mixture of 25–75 named users (operations supervisors, QA staff, supply planners, and a few data analysts), plus a set of casual viewers who only peek at dashboards. Moving to InetSoft allowed the company to commit to a compact, bounded license cost that tied to their active developer/designers and a reasonable concurrent user estimate, rather than risking an exploding monthly bill as query patterns spiked. :contentReference[oaicite:1]{index=1}
Resource & infrastructure overhead: the serverless advantage
ThoughtSpot is engineered to scale, and that requires a cluster mindset: nodes, shared storage, and careful deployment considerations (cloud VM sizing, on-prem virtualized clusters, network topology). For teams that want high concurrency and very low latency search across large datasets, the tradeoff can be justified, but it adds both operational complexity and a capital/operational cost tail—especially if you maintain on-prem hardware or large reserved instances in cloud. :contentReference[oaicite:2]{index=2}
InetSoft’s serverless, microservice-friendly architecture reduced that overhead for the processor in three practical ways. First, the serverless delivery of StyleBI minimized the need to maintain big clusters or buy specialist appliances—smaller cloud footprints, container-based deployments, or even lightweight embedded instances were sufficient. Second, the microservices approach meant scaling a dashboard service independently of other systems (data ingestion, ETL), so IT could right-size CPU and memory for just the UI/visualization tier. Third, because InetSoft’s visual discovery emphasizes data mashup at the application layer (allowing real-time joins and pre-stitched views) the team could avoid some of the heavier upstream data engineering work they had been doing to optimize ThoughtSpot’s search indices. Those combined savings translated into lower cloud VM spend, reduced patching windows, and fewer outages during upgrades. :contentReference[oaicite:3]{index=3}

Operational savings: fewer admins, faster releases
In practice the Fisheries Byproduct Processor shaved roughly 20–40% off the “BI admin” FTE burden. Under ThoughtSpot the critical path included cluster health monitoring, storage tuning, and the periodic reindexing tasks that keep search performance acceptable. After the migration, most of that work disappeared into the managed-orchestrated layer and smaller scale orchestration tasks; the in-house team shifted from caretakers of a distributed cluster to application managers who focused on security, access, and data mappings. That freed one engineer to move into product analytics and allowed the data pipeline engineer to concentrate on source accuracy instead of query performance tuning.
The company also saw faster iteration cycles. InetSoft’s web-based designer lets power users create and test dashboards without an elaborate CI/CD pipeline; for the processor that meant new operational KPI dashboards could be prototyped and released in days rather than weeks. The faster release cadence reduced effort on change requests and decreased the number of “dashboard wars” where IT and business argued over who owned small visual tweaks.
Support and vendor relationship: practical benefits
Vendor support costs are often invisible until you need a critical patch or a data connector updated. The Fisheries firm reported that InetSoft’s typical engagement model—direct onboarding help, clear update paths, and conservative patching windows—felt more personalized and less enterprise-bureaucratic than their ThoughtSpot experience had been. That matters for niche industries: when your data sources include nonstandard marine weigh scales, custom HACCP compliance exports, or third-party catch certification APIs, vendor willingness to engage on connector work or to give focused troubleshooting beats a one-size-fits-all support SLA. InetSoft’s smaller footprint and more configurable connectors shortened the time to resolution for those edge cases, which the plant’s operations team valued highly.
Management and end-user satisfaction
From an executive perspective, the migration delivered two visible wins: a predictable line item on the P&L and faster, measurable operational improvements. Supervisors reported quicker answers to urgent questions—“Which lot is dropping below expected yield?” or “Which supplier deliveries are correlated with rising fatty acid variance?”—because dashboards were simpler, faster to open, and easier to bookmark for shift-handovers. End-user satisfaction surveys taken three months post-migration showed improved usability scores from shop-floor supervisors and QA staff who previously found ThoughtSpot’s search-centric UI powerful but sometimes opaque; many preferred the familiar chart & filter style of InetSoft dashboards and the ability to save personalized views without IT assistance.
On the flip side, advanced analysts missed some of ThoughtSpot’s search-first discovery primitives—natural language search and AI-driven insights can surface nonobvious correlations quickly. The IT team preserved a hybrid approach: keep a small analytics sandbox for heavy, exploratory work but make InetSoft the primary operational and embedded dashboard platform. That hybrid reduced overall cost while preserving the occasional high-value exploration workflow.
Concrete numbers and expectation management
Every migration is unique and pricing varies by deal structure, but a realistic pattern emerged in this case: the processor’s annual InetSoft outlay (developer pack + concurrent user license and modest onboarding) landed in the low-to-mid thousands per year instead of tens of thousands per year when factoring ThoughtSpot’s per-user and/or consumption billing at the scale they needed. The hardware and cloud savings—not needing to reserve large clusters or maintain heavy VM fleets—provided immediate operational savings, while predictable license renewals simplified budgeting. (InetSoft documents modest entry points for small packs; ThoughtSpot documents per-user and consumption options.) :contentReference[oaicite:4]{index=4}
Lessons learned and recommendations for similar manufacturers
For other processors or manufacturers considering a similar move I’d recommend three pragmatic steps. First, map real user behavior: how many true power analysts vs. casual viewers do you actually have? Second, model a 12-month total cost of ownership that includes license, cloud/infra, and admin FTE time—don’t just compare list prices. Third, pilot with real operational dashboards (yield, rejects, supplier variance) and measure time-to-answer and satisfaction before a full cutover. Those steps minimize risk and preserve the analytics capabilities that matter most to operations.