Big Data Visualization Solution
When dealing with big data, it can be difficult to find a software that allows you to present effective visualizations in order to gain greater insight into the information. However, with InetSoft's big data visualization software, users can create pixel-perfect interactive dashboards and reports with just a few simple clicks.
The term big data refers to data sets that have grown to be so large that traditional tools are no longer usable. With the usage of big data sets across growing industries, it has been crucial to develop tools that can easily run queries and analyses on vast amounts of data, while presenting the information in a way that makes it easier to understand. InetSoft's data grid caching technology enables fast analysis on big data sources by using a state-of-the-art combination of in-memory database reporting and disk-based access, which means that users will never have to deal with unnecessary lag time.
InetSoft's user friendly interface allows users to manipulate and explore their data without having to rely on IT. This self-service not only reduces the company's overall costs but also allows for more collaboration within the workplace on the data visualizations, as anyone with a basic understanding of excel can create and explore dashboards.


Benefits of Big Data Visualization with InetSoft
InetSoft's big data visualization software provides many advantages over the competitors such as:
- Rapid Implementation- deployment time is minimized, requiring only a web browser for end-users and developers. Any IT person with basic database administration skills can install and set up the software.
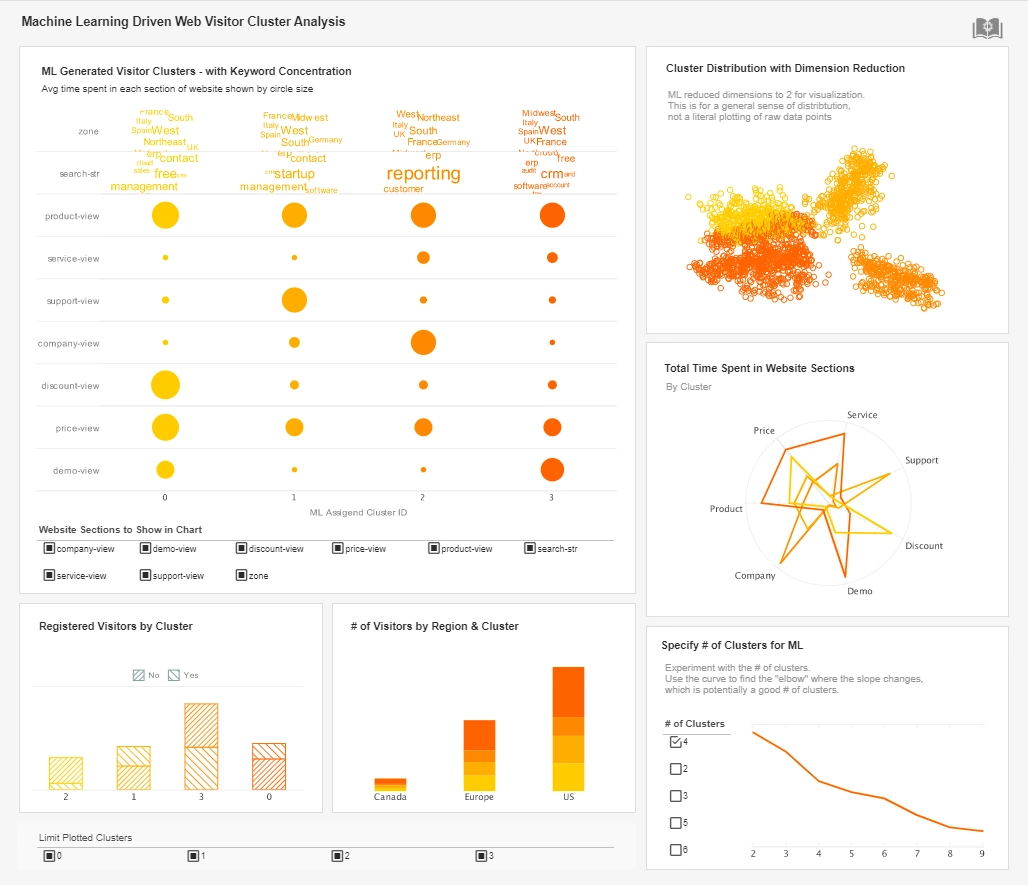
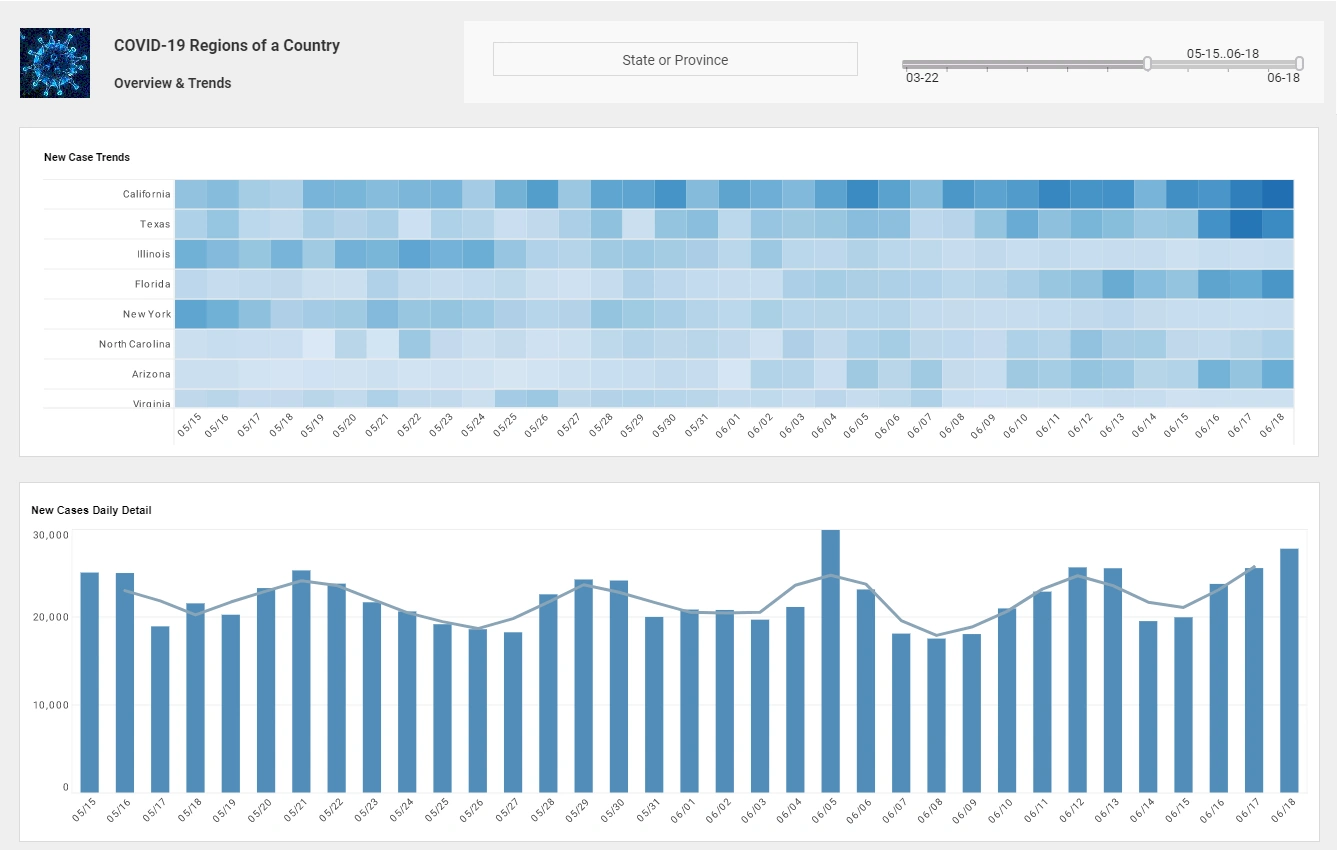
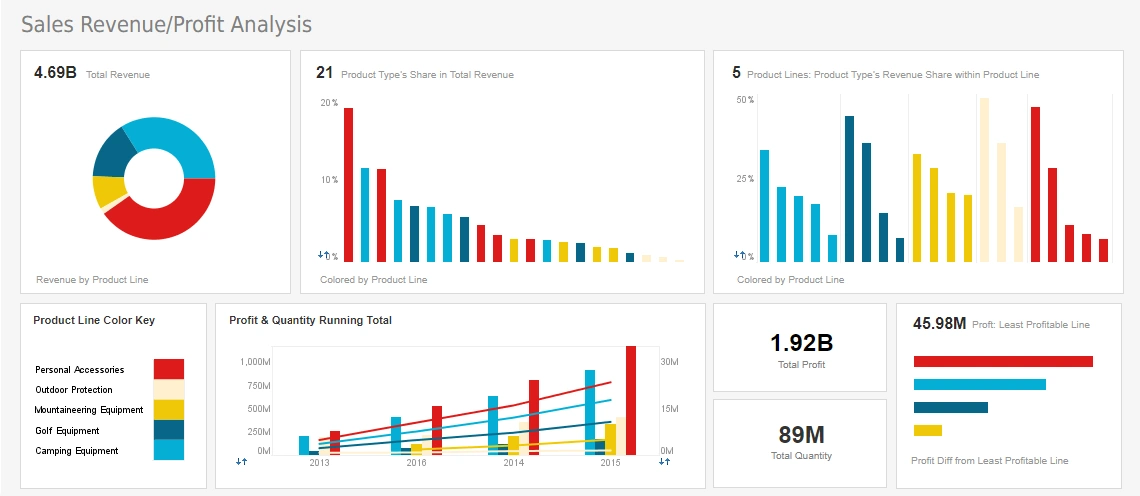
- Simplicity for End Users- InetSoft's drag and drop software allows users to quickly create sophisticated dashboards and reports. Visual analysis and intuitive point-and-click tools such as brushing and multidimensional charting allow users to explore data and identify trends.
- Optimized for Embedding- ISV, SaaS providers, and enterprise developers can embed InetSoft's dashboards and reports in any Web-based application.
- High Performance Infrastructure- When necessary, performance is maximized via clustering and caching and can be fine-tuned with optimization techniques, such as automatic pre-aggregation to reduce lag time, no matter how big the data set is.

Build Mashups of Big Data and Any Other Source
One of the major features that sets InetSoft apart from the rest is its unique ability to provide users with seamless mashups of data from various sources. Data from a big data source can be combined with almost any other data source found in your enterprise, including SQL databases, XML, SOAP, Java beans (POJO), EJB beans, OLAP cubes, SAP ERP, PeopleSoft, Siebel CRM, Google AdWords & Analytics, JDE, salesforce.com, MapR, SAP HANA and more.
The ability to combine data from previously disparate sources allows users to have the opportunity to spot trends and correlations that were not previously able to be seen. Once combined, the data can be dynamically mashed up, manipulated, and transformed as lego-like blocks of data, allowing the user to display exactly what is needed.
In just a few simple clicks, you can get started with InetSoft's award-winning big data visualization software. Interested in finding out more? Request a personalized demo today!