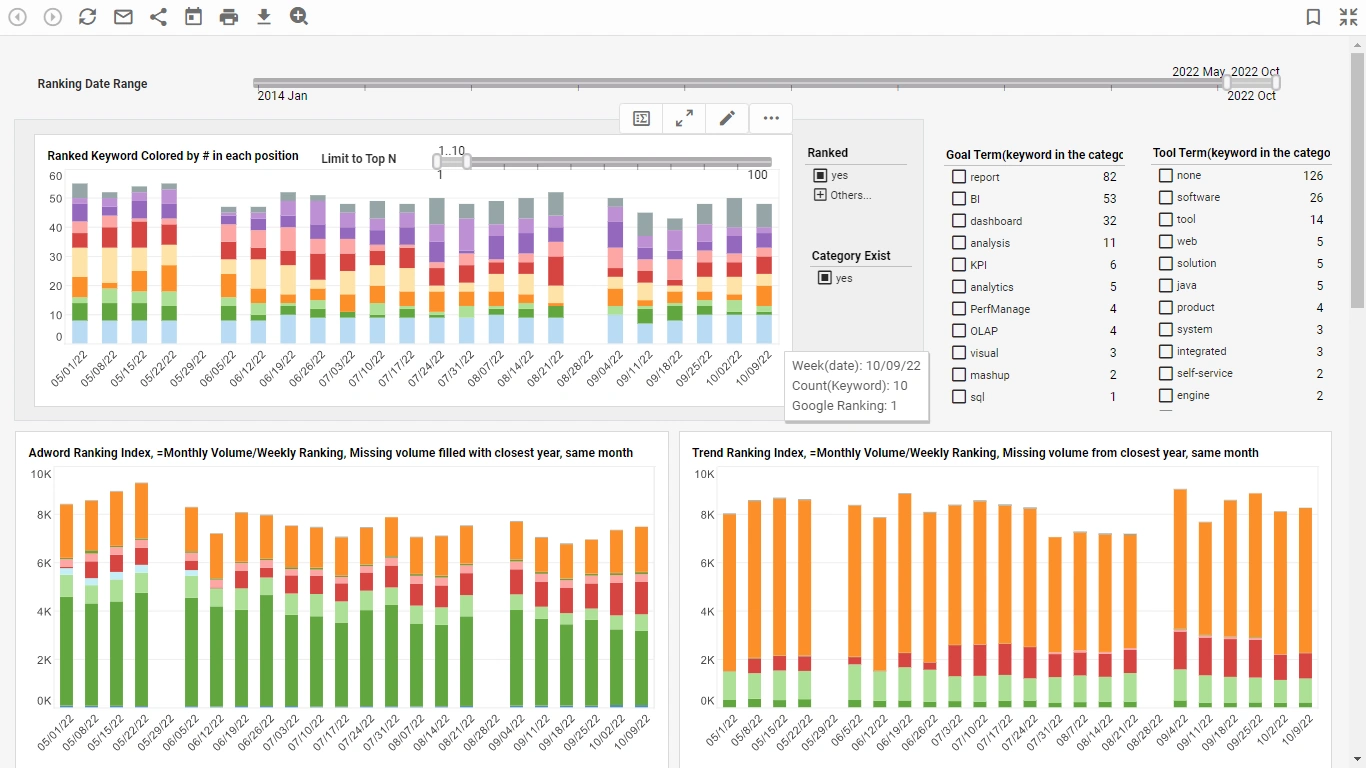
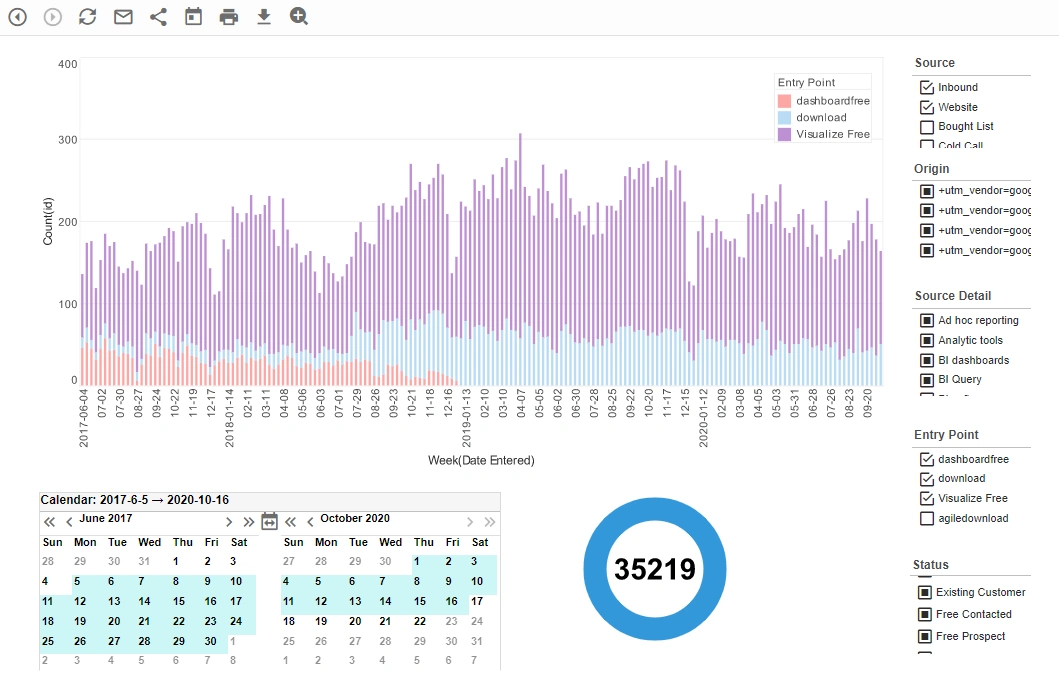
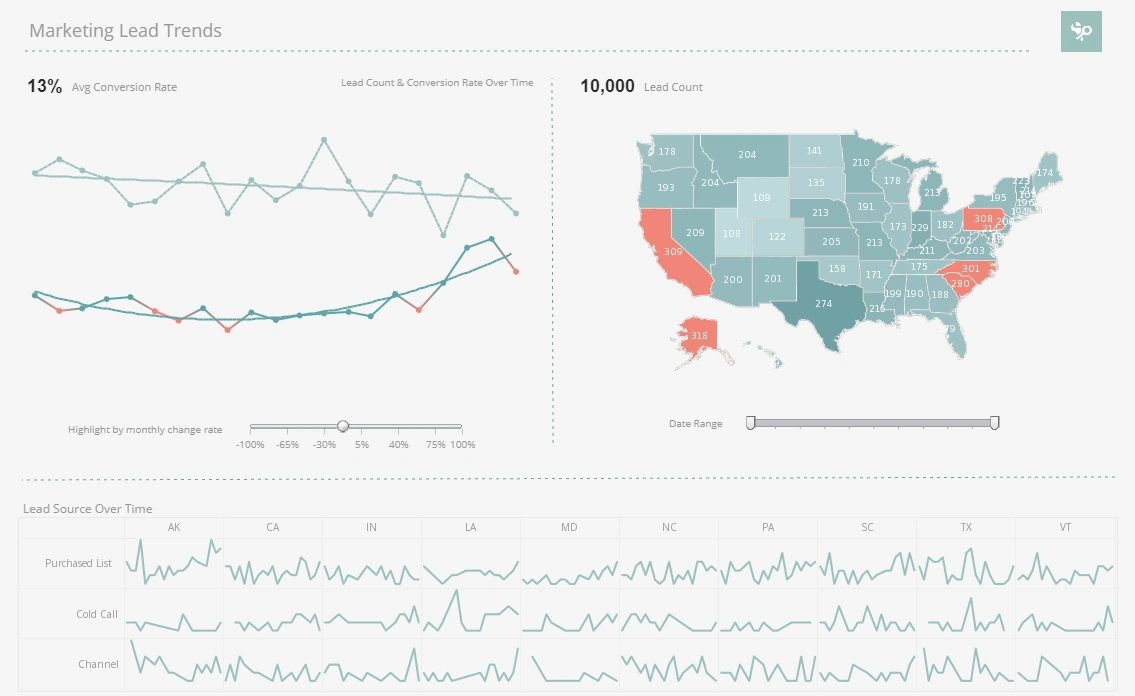
InetSoft's Weekly Dashboard Examples
Weekly dashboards are vital for the regular monitoring and control of business conditions. But in many cases, the production of weekly dashboards puts additional demands on administrators and employees.
And with so much business travel and work done out in the field, dashboard accessibly and deliverability can also be an issue.
InetSoft's solution, StyleBI, makes the setting up and delivery of weekly dashboards easy and efficient.

Easy to Use and Access for Maximum Convenience
Make your weekly dashboards accessible in the office, at home, or in the field.
Our solution is easy to learn; only basic Excel skills are needed. Companies who use our software see the value of this when managers start creating their own ad hoc reports, without support from IT. And with our mobile capabilities, report access is no longer an issue. StyleBI is a web-based solution, which can be accessed on Ipads, Iphones, laptops, and other mobile devices.
Make them personalizable to each user whether they are c-level, managers, or frontline workers.
Data Mashup and Drilldown - Flexible, Interactive Reporting
Give your user's the power to discover new insights into your company's data
With StyleBI, you won't have to run redundant dashboards because of limited data access. InetSoft's solution can mashup data from many diverse sources in real time, giving you maximum flexibility in report generation. Reports can also be made interactive with drilldown capability, enabling managers to find further insights in the data. Certain patterns or thresholds in the data can be set to trigger alerts, ensuring that certain conditions do not escape the reader's attention.
Comparing TapClicks and StyleBI: A Detailed Analysis of Two Weekly Dashboard Tools
Marketing and business intelligence teams increasingly rely on advanced analytics platforms to measure performance, monitor campaigns, and deliver actionable insights. Two platforms often considered in this space are TapClicks and InetSoft’s StyleBI. While both offer data visualization, reporting, and dashboarding capabilities, their approaches, target audiences, deployment models, and integration capabilities differ significantly. A careful comparison between TapClicks and StyleBI highlights their respective strengths and helps organizations determine which platform aligns best with their analytics strategy.
Platform Focus and Target Audience
TapClicks is primarily designed as a marketing operations platform. Its core strengths lie in aggregating data from multiple marketing channels, including paid media, social platforms, and web analytics tools. The platform is optimized for marketing agencies, media companies, and corporate marketing departments that need to consolidate campaign data into a single reporting environment. TapClicks emphasizes automated data pipelines, pre-built connectors for marketing platforms, and marketing-specific KPIs.
StyleBI, in contrast, is a general-purpose business intelligence platform suitable for a wide range of industries, from manufacturing and finance to healthcare and retail. It targets both technical and non-technical users who need self-service analytics, web-based dashboards, and ad hoc reporting. While marketing teams can certainly use StyleBI, its open-source architecture and data mashup capabilities make it ideal for organizations that want to integrate multiple operational, financial, and external data sources beyond marketing metrics.
Deployment Models and Accessibility
TapClicks is a cloud-native solution, delivered entirely as a Software-as-a-Service (SaaS) platform. Users access dashboards, reports, and analytics through a browser, with TapClicks managing infrastructure, updates, and data security. The SaaS approach simplifies deployment, making it easy to onboard marketing teams quickly without requiring in-house IT resources. However, this cloud-centric model can limit customization options and restrict organizations that require on-premises deployment or full control over their analytics environment.
StyleBI offers greater flexibility in deployment. It can be hosted on-premises, in a private cloud, or as a hybrid solution, depending on organizational needs. Its web-based architecture ensures universal access from desktops, tablets, or mobile devices, similar to TapClicks. The platform’s open-source nature allows organizations to customize deployments, integrate with proprietary systems, and control data storage, security, and scalability. For companies with regulatory requirements or complex IT infrastructures, StyleBI’s flexibility is a significant advantage over fully managed SaaS platforms like TapClicks.

Data Integration and Connectivity
TapClicks excels at connecting to marketing and digital advertising platforms. It offers hundreds of pre-built connectors for social media, paid search, email, and web analytics services. The platform’s automated data pipelines normalize and transform marketing data, enabling users to generate dashboards and reports quickly. However, while TapClicks allows some connection to general business databases, its primary focus remains marketing channels, making it less suitable for multi-departmental or operational analytics.
StyleBI provides a broad range of data integration options. It connects to SQL and NoSQL databases, spreadsheets, cloud applications, web APIs, and flat files. Its Data Block™ technology allows users to combine multiple datasets on the fly, creating mashups that integrate operational, financial, and external data into a single view. This flexibility enables organizations to perform cross-functional analytics, such as combining marketing performance with inventory, sales, and customer support data, which is more difficult to achieve in TapClicks without extensive manual processes.
User Experience and Self-Service
TapClicks offers a highly visual and structured interface aimed at marketing analysts and managers. Its dashboards are pre-configured with standard metrics and KPIs, providing out-of-the-box insights with minimal setup. While this approach is convenient for marketing teams, it can be restrictive for users who want to create custom reports, perform ad hoc analyses, or explore new metrics beyond the predefined templates.
StyleBI emphasizes self-service and flexibility. Its drag-and-drop query builder enables both technical and non-technical users to create custom reports and dashboards without writing SQL code. Users can define filters, aggregates, and visualizations on the fly, enabling exploratory analytics. This self-service capability empowers departments beyond marketing to independently analyze data, experiment with new metrics, and respond quickly to business questions without depending on IT or external support.
Visualization and Dashboarding
TapClicks offers visually appealing dashboards tailored to marketing analytics, with interactive charts, graphs, and campaign tracking widgets. It focuses on providing clarity for marketing KPIs such as cost per lead, click-through rates, and conversion metrics. Automated reporting and white-labeled dashboards make it easy for agencies to deliver client-facing reports efficiently.
StyleBI provides a broader range of visualization options, including charts, tables, heat maps, geographic maps, and complex interactive dashboards. While it may require more initial setup compared to TapClicks, it offers greater flexibility in designing dashboards for multiple purposes beyond marketing, including operational monitoring, financial analysis, and executive reporting. Users can also embed dashboards in internal portals or client-facing platforms, fully customizing the look and feel.
Scalability and Performance
TapClicks is designed to handle marketing data at scale, including multiple clients, campaigns, and social channels. Its SaaS infrastructure scales automatically, ensuring fast performance without manual intervention. However, the platform is optimized for marketing use cases and may not perform as efficiently when integrating large, heterogeneous datasets from diverse enterprise systems.
StyleBI is designed to handle large volumes of data across departments, supporting concurrent users, complex queries, and large datasets. Its caching, data aggregation, and performance optimization features ensure that even high-demand environments can deliver interactive analytics efficiently. Organizations with diverse data requirements or multi-departmental reporting benefit from StyleBI’s enterprise-grade scalability and flexible architecture.
Customization and Extensibility
TapClicks provides limited customization beyond the marketing-focused dashboard templates. Agencies can adjust visual themes, select KPIs, and schedule reports, but deeper modifications, integration with proprietary systems, or embedding into custom software require additional development work or third-party tools.
StyleBI’s open-source framework allows extensive customization and extensibility. Organizations can create custom connectors, design unique visualizations, implement complex data transformations, and embed dashboards into internal or client-facing applications. This flexibility enables long-term adaptation to evolving business needs, making StyleBI suitable for enterprises with complex or growing analytics requirements.
Support and Community
TapClicks offers professional support and training, with a focus on marketing analytics use cases. The vendor provides documentation, webinars, and client success programs, ensuring that marketing teams can quickly leverage the platform. However, the support is primarily oriented toward marketing metrics and reporting.
StyleBI benefits from both an open-source community and professional support from InetSoft. The open-source nature allows organizations to access source code, share best practices, and leverage community contributions. Enterprise support ensures guidance for deployment, integration, customization, and optimization across diverse business domains. This combination provides broader support for varied use cases beyond marketing analytics.
Cost Considerations
TapClicks operates on a subscription-based SaaS model, with pricing typically based on the number of users, data sources, or clients managed. While convenient, costs can escalate with additional users or expanded analytics needs. Enterprises seeking wide deployment across multiple departments may face significant recurring expenses.
StyleBI offers an open-source option that reduces licensing costs, along with enterprise editions for organizations requiring advanced support, security, and scalability. Its cost structure is more predictable for large deployments and allows organizations to extend analytics to multiple departments without per-user fees, making it an attractive alternative for companies seeking long-term value.
Summary
TapClicks and StyleBI both deliver powerful analytics capabilities, but their approaches cater to different organizational priorities. TapClicks excels in marketing-specific analytics, automated reporting, and SaaS convenience, making it ideal for agencies and marketing teams seeking rapid deployment and pre-configured insights. StyleBI, in contrast, offers open-source flexibility, broad data integration, self-service analytics, and enterprise scalability, making it suitable for organizations that require a versatile BI platform across multiple departments or industries.
Organizations focused solely on marketing campaigns may prefer TapClicks for its convenience and marketing-centric KPIs. Companies that need multi-departmental reporting, web-based self-service, and long-term flexibility will find StyleBI better suited to their needs. Evaluating deployment requirements, data integration complexity, user base, and budget considerations is essential when choosing between the two platforms to ensure alignment with business goals and analytics strategy.