Interested in Weekly Reporting Tools?
Weekly reports are vital for the regular monitoring and control of business conditions. But in many cases, the production of weekly reports puts additional demands on administrators and employees.
And with so much business travel and work done out in the field, report accessibly and deliverability can also be an issue. Our solution, StyleBI, makes the setting up and delivery of weekly reports easy and efficient.


Deliver Reports Automatically
Set up all of your reports to run automatically, without sacrificing flexibility and control
With our Report Scheduler, you can automate an unlimited number of weekly reports, without creating additional work for IT or administrators. The Report Scheduler can be programmed to generate reports at any regular interval, whether its a daily, weekly, or quarterly basis. Lists can be created for mass or targeted distribution.
A report can also be triggered on a certain date or when a certain condition or threshold is met. The function of report delivery is also fully automated and scheduled. Reports can be automatically delivered by email or print, as well as exported into Word, Excel, Powerpoint, PDF, and other formats. They can also be saved in an archive for compliance reasons.
Easy to Use and Access for Maximum Convenience
Make your reports accessible in the office, at home, or in the field
Our solution is easy to learn; only basic Excel skills are needed. Companies who use our software see the value of this when managers start creating their own ad hoc reports, without support from IT. And with our mobile capabilities, report access is no longer an issue.
StyleBI is a web-based solution, which can be accessed on Ipads, Iphones, laptops, and other mobile devices. All that is required on the end user device is an HTML5 browser. The server is Java-based and can be installed on any OS, in the cloud or self-hosted on premise.
Data Mashup and Drilldown - Flexible, Interactive Reporting
Give your user's the power to discover new insights into your company's data
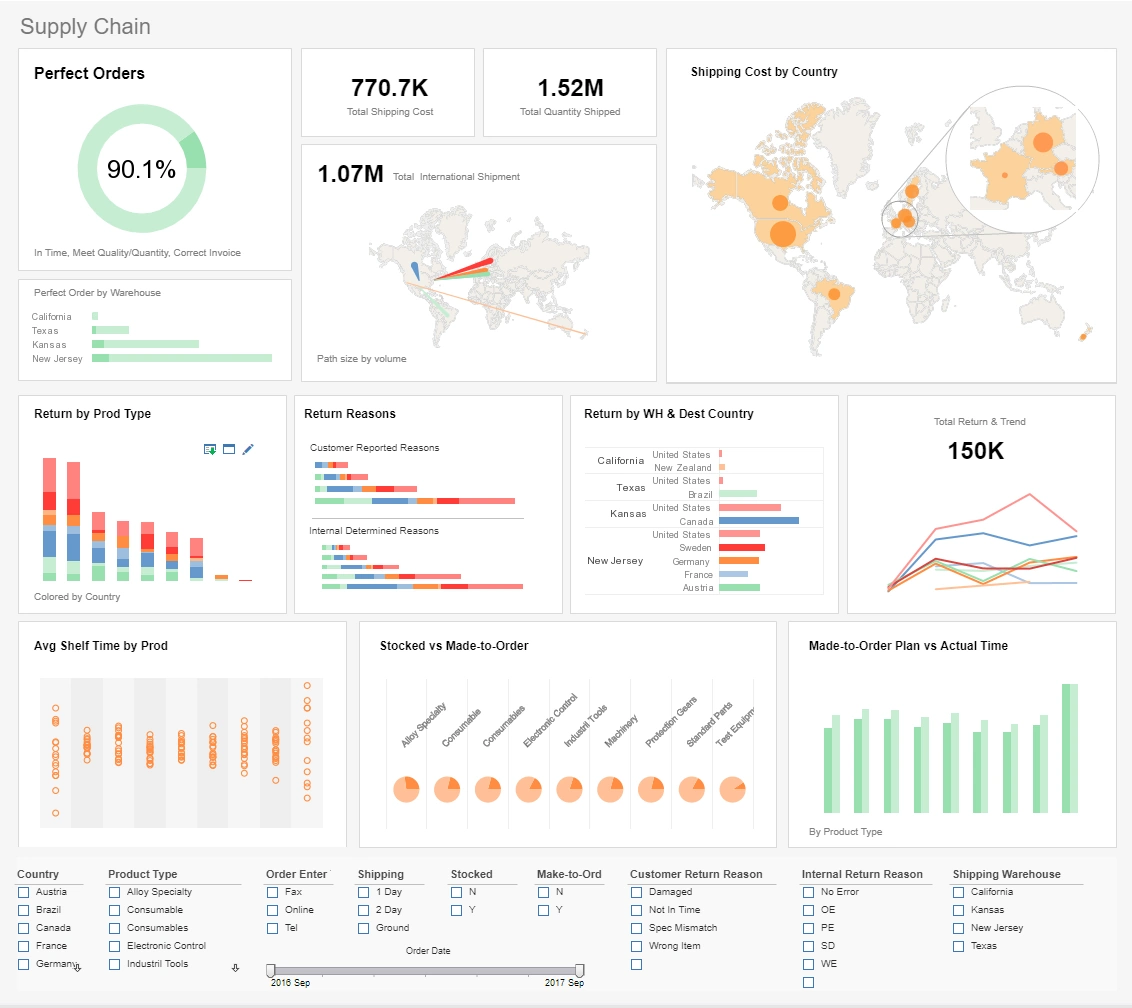
With StyleBI, you won't have to run redundant reports because of limited data access. Our solution can mashup data from many diverse sources in real time, giving you maximum flexibility in report generation.
Reports can also be made interactive with drilldown capability, enabling managers to find further insights in the data. Certain patterns or thresholds in the data can be set to trigger alerts, ensuring that certain conditions do not escape the reader's attention.

What Does a Vice President of Content Development and Production in the Entertainment Industry Need to See in a Weekly Report?
-
Project Status Updates: Detailed information on the status of each project in development or production. This includes any significant milestones achieved, challenges faced, and progress made towards completion.
-
Budgetary Information: A breakdown of the budget for each project, including expenditures to date, remaining budget, and any potential overages or cost-saving measures implemented.
-
Timeline and Schedule: A timeline showing the project's progress compared to the initial schedule. This should highlight any delays, adjustments to the timeline, and upcoming milestones.
-
Resource Allocation: Information on the allocation of resources such as crew members, equipment, and studio space. This includes any adjustments made to accommodate changes in project scope or schedule.
-
Creative Elements: Updates on creative aspects, including script development, casting decisions, production design, and any other relevant creative elements that contribute to the overall vision of the project.
-
Risk Assessment and Mitigation: Identification of potential risks or challenges that could impact the project's success, along with strategies for mitigating these risks.
-
Performance Metrics: Key performance indicators (KPIs) related to the project's performance, such as audience engagement (if applicable), social media buzz, or other relevant metrics.
-
Market Research and Audience Insights: Insights into the target audience, market trends, and competitive landscape. This helps ensure that the project is aligned with audience preferences and industry trends.
-
Feedback and Stakeholder Input: Summarized feedback from key stakeholders, including creative teams, producers, and any external partners or investors involved in the project.

About InetSoft
Since 1996 InetSoft has been delivering easy, agile, and robust business intelligence software that makes it possible for organizations and solution providers of all sizes to deploy or embed full-featured business intelligence solutions. Application highlights include visually-compelling and interactive dashboards that ensure greater end-user adoption plus pixel-perfect report generation, scheduling, and bursting.
InetSoft's patent pending Data Block™ technology enables productive reuse of queries and a unique capability for end-user defined data mashup. This capability combined with efficient information access enabled by InetSoft's visual analysis technologies allows maximum self-service that benefits the average business user, the IT administrator, and the developer. InetSoft solutions have been deployed at over 5,000 organizations worldwide, including 25% of Fortune 500 companies, spanning all types of industries.

More Articles for Users of Weekly Reports
Evaluate InetSoft's Monthly Report Consolidation Tools - Are you looking for a good monthly report consolidation tool? InetSoft's pioneering reporting application mashes up financial data from multiple sources to produce pixel-perfect consolidation report pdfs with an easy-to-use drag-and-drop designer. This helps ensure the building of a knowledge base that can be passed on. Next, be sure to provide the visibility so that you can understand the reporting...
Features of a Good Automated Market Report Solution - Data Aggregation: The solution should be capable of gathering and consolidating data from various reliable sources. This includes real-time market data, historical trends, and relevant industry news. Customization Options: Users should have the flexibility to customize the reports to meet their specific needs. This could include selecting data parameters, timeframes, chart types, and other relevant variables...
Recommend a Weekly Staff Reporting Tool - Looking for a good weekly staff reporting tool? InetSoft's pioneering dashboard reporting application makes producing great-looking web-based reports and dashboards easy with a drag-and-drop designer and the ability to connect to all your data sources. Maximize self-service for all types of users. No dedicated BI developer required. View a demo and try interactive examples...
Scheduler Task Defines The Batch Operation - A scheduler task defines the batch operation to be performed. It specifies the time condition, the reports to be generated and their delivery mechanism (email, print, archive, save to disk, etc.). Both the Enterprise Manager and the InetSoft Report Portal provide interfaces to create, edit, and monitor scheduled tasks...

Weekly Reports for Leadership - Searching for a leadership weekly report tool? Easily build formatted or interactive leadership weekly reports with InetSoft's advanced flexible BI tool. Highly rated for customer service and ease of deployment, InetSoft has been a pioneer in self-service BI since 1996. View a demo and try interactive examples...
Using Automatic Report Thresholds - Reports can also be made interactive with drilldown capability, enabling managers to find further insights in the data. Certain patterns or thresholds in the data can be set to trigger automated alerts, ensuring that certain conditions do not escape the reader's attention. Alerts can be delivered by email or text...