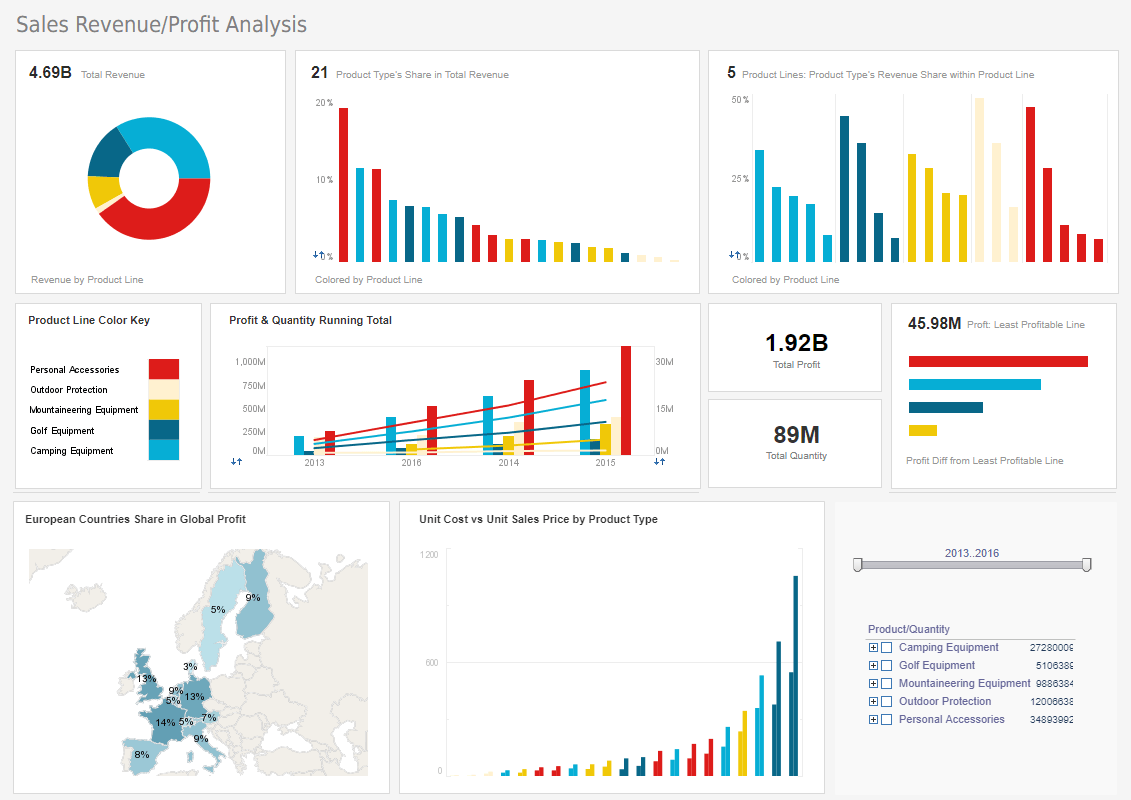
InetSoft Product Documentation: Business Highlights Dashboard
InetSoft's Style Intelligence offers an easily modified powerful analytic visualization dashboard. This enables users to study fluctuations and trends at a glance. View the example below to see how you might benefit from this invaluable analytic tool.
You can highlight specific geographic levels in a map based on the data they represent. For example, you can highlight an entire state, or highlight just the cities within the state.
In this example, you will highlight in green all the states where the Sum(Quantity Purchased) ranges from 0-1500, and highlight in red all the states where the Sum(Quantity Purchased) ranges from 1500-5000.
- Right-click the map, and select �Properties� from the context menu. This opens the �Map Properties� dialog box.
- Select the Data tab. From the �Value Display� menu, select �Value�. This will display numeric values on the map, rather than state names.
- Select the Advanced tab. In the �Range� panel, select the geographical layer which you wish to highlight from the �Layer� menu. (In this example, �State� is the only available layer.)
- Click the �More� button to add the first highlight range:
- Enter �0� in the �From� field and �1500� in the �To� field.
- Choose green from the �Background� selector.
- Click the �More� button again to add the second highlight range:
- Enter �5000� in the second �To� field.
- Choose red from the �Background� selector.
- (Optional) Select �Interpolate� to grade the color according to the actual data value associated with the region.
- Click �OK� to close the dialog box and apply the highlighting.
| #1 Ranking: Read how InetSoft was rated #1 for user adoption in G2's user survey-based index | Read More |
| Previous: Intuitive Business Dashboard |


