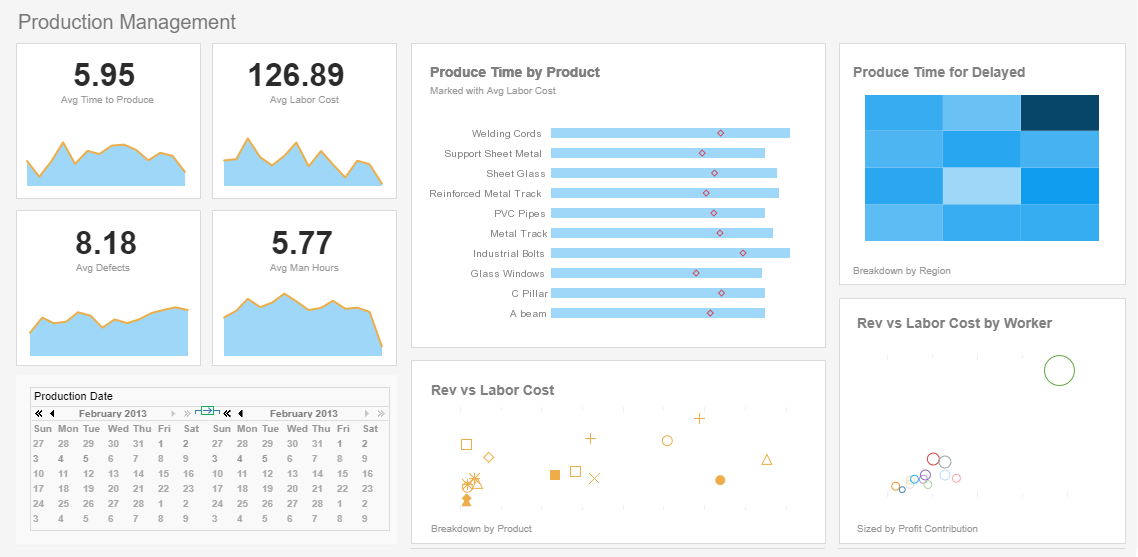
InetSoft Product How-To: Creating a Dashboard
The Visual Composer is a web-based tool for creating Data Worksheets, Viewsheets, and other assets. You will use the Visual Composer to link graphical components of a Viewsheet to the data assets constructed within a Worksheet. For example, you will link a Range Slider to a date field, or link a gauge to the aggregate of a numeric column.
This section walks you through the creation of a simple Viewsheet. The exercise uses an existing Worksheet called ‘ProductSales’, which is included in the default installation. It is based on the sample ‘Orders’ data source. To create this Viewsheet, follow the steps below:
Launch the Visual Composer from the Portal. (Select the Design tab and then the ‘Visual Composer’ option.)
- Click on the ‘New Viewsheet’ button. The ‘Select a Worksheet’ dialog box will open. Expand ‘Global Worksheet’ and the ‘Tutorial’ folder. Select the ‘ProductSales’ Worksheet. Click ‘OK’.
- Drag the ‘SalesByDate’ Data Block from the left pane into the grid. This creates a Table containing the Data Block’s columns.
- Expand the ‘SalesByDate’ node to show the list of fields within that Data Block.
- Click and drag the ‘State’ field to an empty cell in the grid. This creates a Selection List that will let you choose the states to include.
- To limit the dates included in the data set, drag a ‘Range Slider’ component from the left pane into an empty cell in the grid.
- To link this Range Slider to the appropriate data, drag the ‘Date’ field from the tree, and drop it onto the Range Slider component in the grid.
- Click on the ‘Preview’ button on the main toolbar. This opens a preview window that allows you to view and manipulate the Viewsheet as a user.
- Close the preview window, and return to the design view.
- In the design view, use the main toolbar to change the fonts, colors, and other visual properties of the elements. (The right-click context menu for each element provides further options.)
- Click the ‘Save’ button on the toolbar to open the ‘Save Viewsheet’dialog box. Enter “MyFirstViewsheet’ as the name, then click ‘OK’. This saves the Viewsheet into the Repository, where you can access it at a later time.
You have now constructed your first Dashboard.

