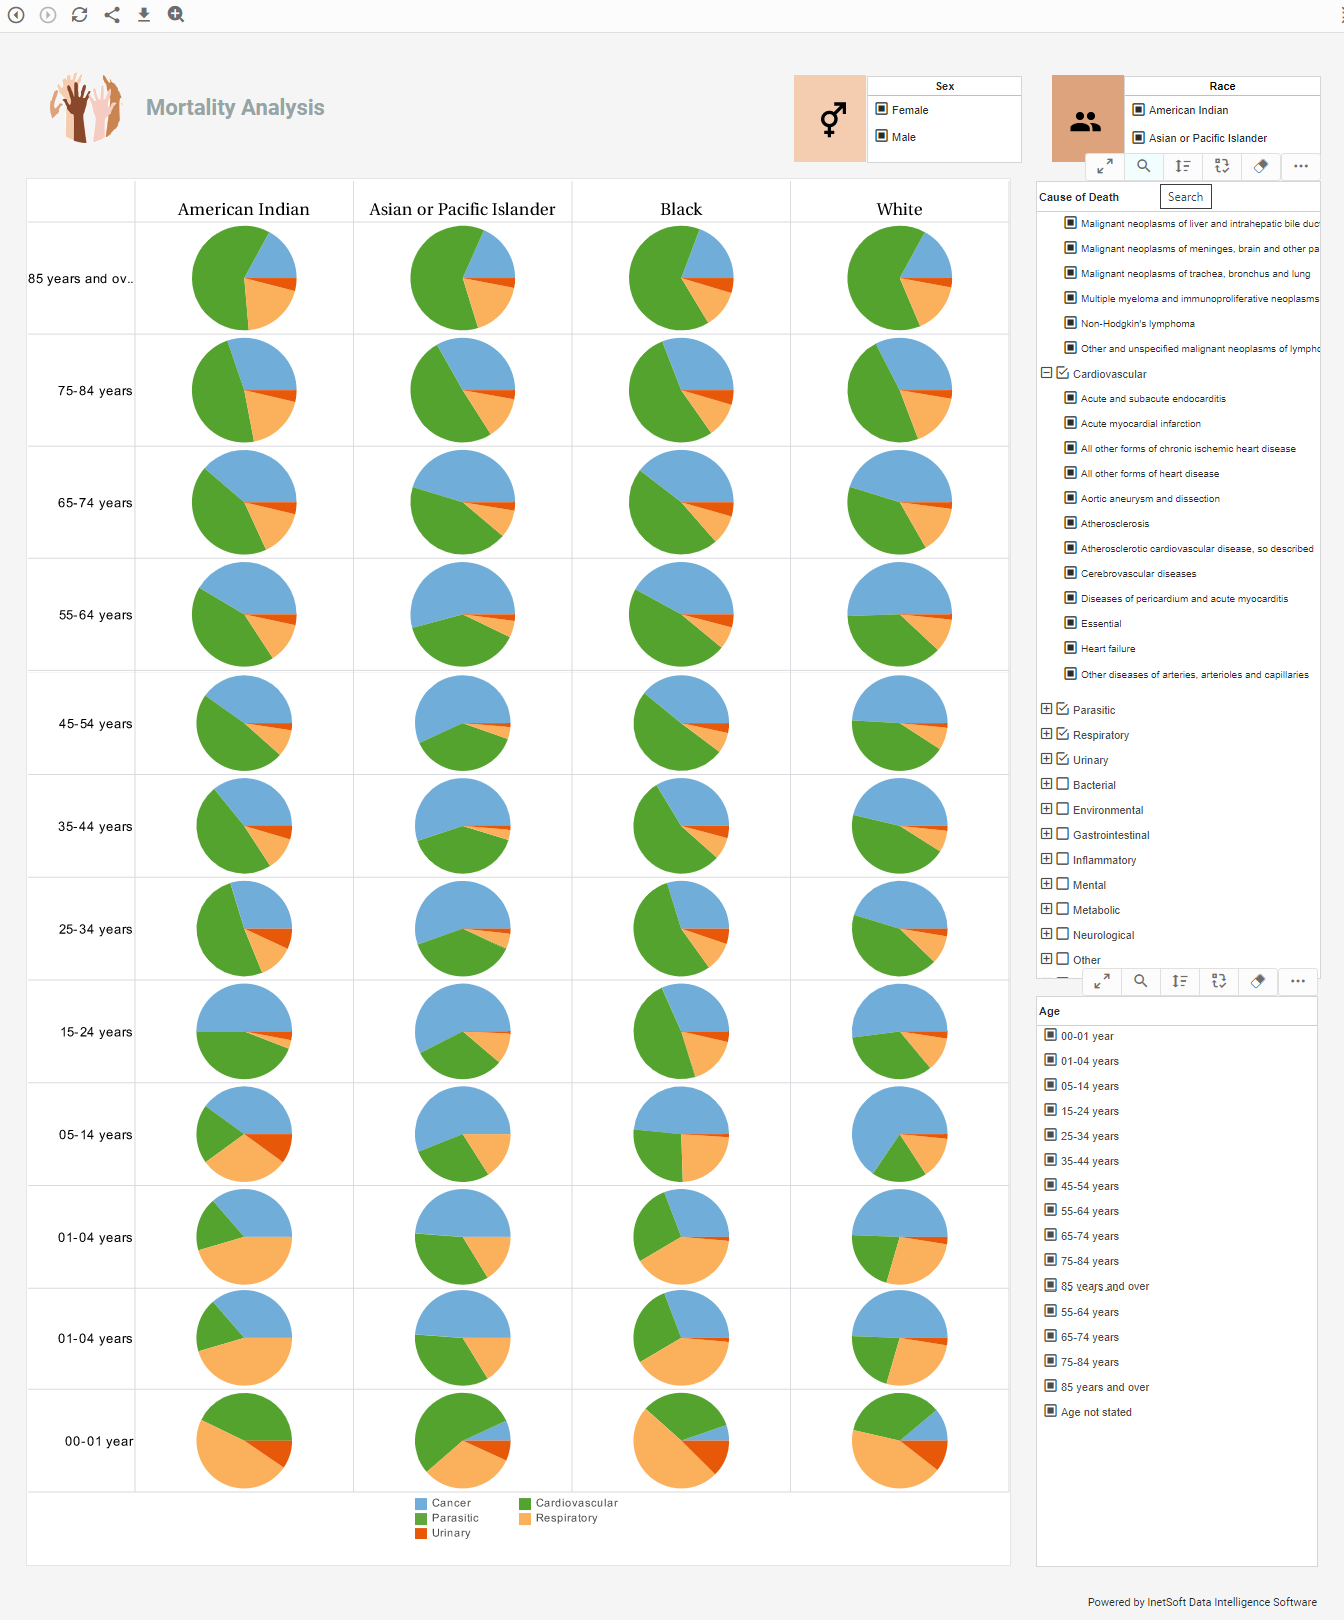
InetSoft Product How-To: Creating a Dashboard Visualization Selection Tree
InetSoft's dashboard visualization tree is created by a simple process that allows users to interact with data in quick and meaningful ways. To create a Selection Tree, follow the steps below:
- Drag a Selection Tree component from the Component tree onto the Viewsheet grid. This creates an empty Selection Tree element. You can also drag and drop a single column directly onto the empty Selection List element.
- Right-click the Selection Tree, and select �Properties� from the context menu. This opens the �Selection Tree Properties� dialog box.
- Select the Data tab.
- In the �Table� menu, expand the desired Data Block to reveal its columns, or expand a cube dimension to reveal its levels.
- Select the column or level that you want to be the outer-most level of the Selection Tree hierarchy.
- Click �Add�. This adds the column or level to the �Level� list.
- Repeat to add all desired levels of the hierarchy. To change the hierarchy ordering, use the ‘Move Down’ and ‘Move Up’ buttons. The order from top to bottom represents the nesting order of the Selection Tree, from outer to inner.
The Selection Tree is now populated based on the selected columns or dimension levels. The inner levels of the hierarchy show only the unique items compatible with corresponding outer level data. For example, the companies nested within the outer-level ‘CA’ node are only those companies whose corresponding state is CA.
To create a Selection Tree from a chart Data Source tree, follow these steps:
- Expand a 'Dimension' node in the Data Source tree. (This can belong to either a Data Block or cube.) To include all levels of a cube dimension, simply drag the dimension node onto the Viewsheet.
- Select two or more columns from the 'Dimension' node, and drag them together onto the Viewsheet grid. This creates a Selection Tree based on the data in the selected fields.
Next: Dashboard Application
