How to Design Hierarchical Data Visualization Dashboards: Patterns, Use Cases, and Best Practices
Many organizations work with data that is naturally hierarchical: organizational charts, product categories, asset trees, geographic regions, and financial roll-ups. When this kind of data is brought into a dashboard, traditional flat charts often fall short. Users need to see how parts relate to the whole, how levels roll up into each other, and how performance changes as they move up and down the hierarchy.
A hierarchical data visualization dashboard is designed specifically to handle these multi-level structures. It allows users to navigate from high-level summaries down to detailed nodes, while preserving context and relationships. Done well, it turns complex trees into intuitive, interactive stories. Done poorly, it becomes cluttered, confusing, and slow.


What Is Hierarchical Data Visualization?
Hierarchical data visualization focuses on representing parent-child relationships and multi-level structures. Instead of showing a single flat list of items, it shows how items are grouped, nested, and rolled up. Each node in the hierarchy can have children, and those children can have their own children, forming a tree.
Common examples include:
- Organizational hierarchies: Company → Division → Department → Team → Employee.
- Product categories: Category → Subcategory → Product line → SKU.
- Geographic hierarchies: Region → Country → State/Province → City → Store.
- Asset structures: Plant → Line → Machine → Component.
- Financial hierarchies: Account group → Account → Sub-account → Line item.
In a dashboard, the goal is not just to display the hierarchy, but to make it explorable. Users should be able to drill down into a branch, roll back up, and compare nodes at different levels without losing their place.
When to Use Hierarchical Dashboards
Hierarchical dashboards are most valuable when the structure of the data is central to the questions being asked. If stakeholders care about how performance rolls up from child entities to parents, or how issues in one branch affect the whole, a hierarchical approach is appropriate.
For example, a retail leader might want to see sales by region, then drill into specific countries, then down to cities and stores. A manufacturing manager might want to see downtime by plant, then line, then machine. In both cases, the hierarchy is not just metadata; it is the lens through which performance is understood.
Visualization Patterns for Hierarchical Data
Different visualization patterns are suited to different types of hierarchies and questions. Choosing the right one is critical for usability.
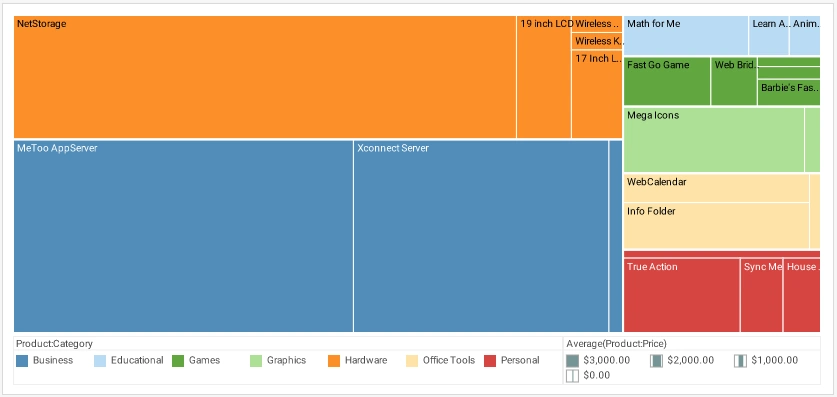
Tree Maps
Tree maps represent hierarchical data as nested rectangles. Each rectangle’s size typically reflects a quantitative value, such as revenue or count, and color can encode another metric, such as growth or margin. Tree maps are excellent for showing how parts contribute to the whole and for spotting large or small segments.
However, they can become hard to read when there are many small nodes or deep hierarchies. They work best when you focus on a few levels and use them for high-level composition rather than detailed navigation.
Sunburst and Icicle Charts
Sunburst charts display hierarchies as concentric rings, with the root at the center and deeper levels moving outward. Icicle charts use stacked bars to show the same structure. Both are useful for showing the full hierarchy at once and for understanding how branches expand as you move down levels.
These charts are powerful for overviews but can be challenging when labels are long or when users need to compare nodes across branches. They are best used when the primary goal is to understand structure and distribution, not to perform detailed numeric analysis.
Collapsible Tree Diagrams and Node-Link Views
Collapsible tree diagrams show nodes connected by lines, similar to a classic org chart. Users can expand or collapse branches to focus on specific areas. This pattern is intuitive for representing parent-child relationships and is especially effective for organizational or asset hierarchies.
Node-link diagrams can become cluttered if there are many nodes or cross-links, so they are best used when the hierarchy is relatively balanced and not too wide at each level.

Indented Lists and Drill-Down Tables
Sometimes the simplest pattern is the most effective. Indented lists or tables with expandable rows can represent hierarchies in a familiar, spreadsheet-like format. Users can expand a parent row to see its children and collapse it to reduce noise.
This approach works well when users care about both structure and detailed numeric values, such as financial statements or account hierarchies. It also integrates naturally with sorting, filtering, and exporting.
Designing Dashboards for Hierarchical Navigation
A hierarchical dashboard is not just a single chart; it is a coordinated set of views that support navigation across levels. Good design makes it easy for users to know where they are, where they can go next, and how to get back.
Drill-down and roll-up interactions are central. Users should be able to click on a node to see its children, and then move back up to the parent level. Breadcrumbs or clear level indicators help maintain context, such as “Region > Country > City > Store: Northeast > USA > Boston > Store 17.”
Level-aware KPIs are also important. At higher levels, metrics might be aggregated across many children, while at lower levels, the same metrics show more granular values. The dashboard should adapt labels and context so users understand what each number represents at each level.

Modeling Hierarchical Data for Dashboards
Underneath the visuals, the data model must support hierarchical queries. This often involves parent-child relationships, recursive hierarchies, or flattened structures with multiple level columns (such as Level1, Level2, Level3).
Recursive hierarchies are flexible but can be more complex to query and may require special functions or modeling techniques in your BI tool. Flattened hierarchies, where each level has its own column, are easier to work with but may be less flexible when the depth varies or when the hierarchy changes over time.
Ragged hierarchies, where some branches have more levels than others, require careful handling. You may need to allow for blank levels or use special logic to roll up values correctly. Performance considerations also matter: deep or wide hierarchies can generate large result sets, so caching, pre-aggregation, or limiting visible levels may be necessary.
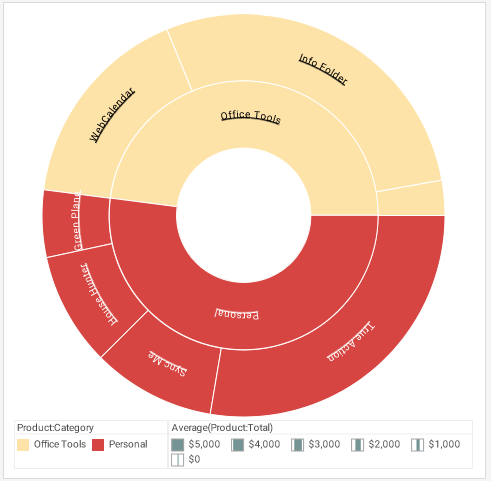
Which Chart Displays a Hierarchical View of Data with Concentric Rings?
The chart type that displays hierarchical data using concentric rings is called a sunburst chart. A sunburst chart visualizes a hierarchy by placing the top-level category at the center and drawing each subsequent level as a ring around it. The deeper the level in the hierarchy, the farther it appears from the center.
Each segment in a sunburst chart represents a node in the hierarchy, and its size is proportional to a chosen metric such as value, count, or percentage. This makes it easy to see how parent categories break down into subcategories and how each branch contributes to the whole structure.
Sunburst charts are especially effective when you need to explore multi-level hierarchical data in a compact, circular layout. They provide a clear visual path from the root to each leaf node, making them ideal for organizational structures, product category breakdowns, website navigation paths, and any dataset where relationships between levels matter.
In the context of hierarchical dashboards, sunburst charts complement other tree-based visualizations by offering a radial, space-efficient view that highlights both structure and proportion. Their concentric rings make them one of the most intuitive ways to understand how complex hierarchies expand outward from a central concept.
Common Mistakes in Hierarchical Dashboards
One common mistake is trying to show too many levels at once. When every node is visible, the result can be overwhelming and unreadable. Progressive disclosure—showing only a few levels and letting users expand as needed—keeps the dashboard manageable.
Another mistake is using a visualization that does not match the depth or complexity of the hierarchy. For example, a tree map with hundreds of tiny rectangles may technically represent the hierarchy but will not help users understand it. Choosing a simpler pattern, such as an indented table with drill-down, may be more effective.
A third mistake is failing to provide clear navigation cues. If users do not know which level they are on or how to return to a previous view, they can quickly become disoriented. Breadcrumbs, titles that include the current node, and consistent drill interactions all help maintain orientation.

Best Practices for Hierarchical Dashboard Design
Start with the top level and the key questions stakeholders want to answer. Design the initial view to show high-level performance across major branches of the hierarchy. From there, define clear drill paths that allow users to move deeper only when they need more detail.
Use progressive disclosure to avoid clutter. Show only the most important nodes by default and let users expand branches of interest. Combine visual summaries, such as tree maps or sunbursts, with more detailed views like tables or lists for deeper analysis.
Keep labels readable and avoid overloading visuals with text. When necessary, use tooltips to provide additional context without crowding the chart. Consider offering multiple views of the same hierarchy—for example, a tree map for composition and a drill-down table for detailed analysis—so users can choose the representation that best fits their task.
Finally, test the dashboard with real users who work with the hierarchy every day. Watch how they navigate, where they get stuck, and which levels they care about most. Use their feedback to refine drill paths, simplify visuals, and adjust the data model. A well-designed hierarchical data visualization dashboard turns complex structures into clear, navigable insights that support better decisions at every level.
Frequently Asked Questions
What Is Hierarchical Data Visualization?
Hierarchical data visualization represents parent-child relationships and multi-level structures such as organizational charts, product categories, and geographic hierarchies. It helps users explore how items roll up into larger groups and how deeper levels relate to higher-level summaries.
What Are Common Visualization Patterns for Hierarchical Dashboards?
Popular visualization patterns include tree maps, sunburst charts, icicle charts, collapsible tree diagrams, node-link views, and drill-down tables. Each pattern supports different types of hierarchical exploration depending on depth, complexity, and the type of analysis required.
How Do Users Navigate Hierarchical Dashboards?
Users navigate through drill-down and roll-up interactions, breadcrumbs, level-aware KPIs, and cross-filtering. These features help maintain context while exploring deeper levels of the hierarchy and make it easier to move between parent and child nodes.
How Should Hierarchical Data Be Modeled for Dashboards?
Hierarchical data can be modeled using parent-child relationships, recursive hierarchies, or flattened level-based structures. Handling ragged hierarchies, ensuring correct roll-ups, and optimizing performance are key considerations when preparing data for hierarchical dashboards.
What Are Common Mistakes in Hierarchical Dashboards?
Common mistakes include showing too many levels at once, choosing inappropriate visualizations, failing to provide navigation cues, and ignoring performance impacts of deep or wide hierarchies. Effective dashboards use progressive disclosure and intuitive drill paths to keep the experience clear and usable.