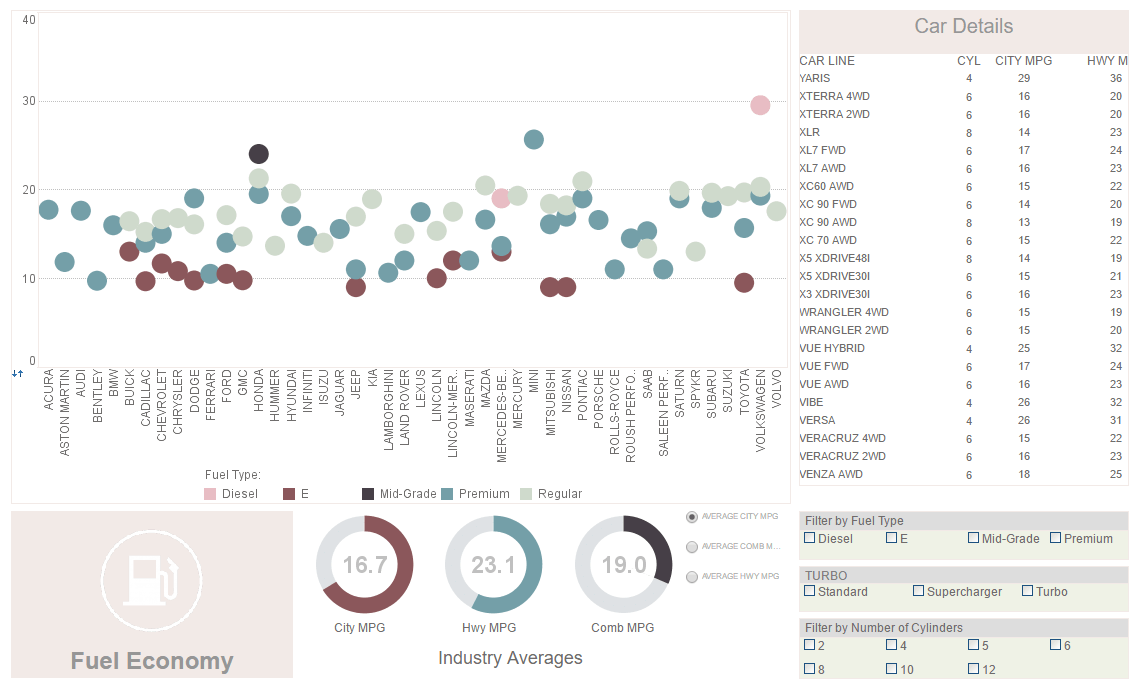
Data Analysis Dashboards with Dual Purpose Controls
InetSoft's data analysis dashboards allow you to produce brilliant visualizations of multidimensional data. View the information below to learn more.
Selection components provide both input and output capability, and are therefore crucial for analysis.
- Selection components control and filter data for data view and output components. By adding multiple selection elements, you exponentially increase possible views.
- Selections interact with one another to provide you with instant feedback on which choices are consistent and which are incompatible.
This dual nature of selections makes them an indispensable analytic component for most dashboards.

| #1 Ranking: Read how InetSoft was rated #1 for user adoption in G2's user survey-based index | Read More |
To create a Selection List, follow these steps:
- Expand a Data Block (table) or cube dimension in the Component tree.
- Select one column from the Data Block, or one level from the cube dimension, and drag it onto the Viewsheet grid.
To create a Selection List follow these steps:
- Drag a Selection List element from the Component tree onto the Viewsheet grid. This creates an empty Selection List element.
- Right-click on the Selection List, and select �Properties� from the context menu. This opens the �Selection List Properties� dialog box.
- Select the Data tab.
- In the �Table� list, expand a Data Block or cube, and select the column or dimension that should be used to populate the Selection List.
- Click 'OK'. This creates a Selection List based on the data in the selected column or dimension.
To create a Selection List from a chart Data Source tree, follow these steps:
- Expand a ‘Dimension’ node in the Data Source tree. (This can belong to either a Data Block or cube.)
- Select one column from the ‘Dimension’ node, and drag it onto the Viewsheet grid.
This creates a Selection List based on the data in the selected field.
| Previous: Supply Chain Management Dashboard |