What Makes a Dashboard Dynamic?
A dynamic dashboard goes beyond static data display—it's interactive, responsive, and tailored to real-time decision-making. It actively empowers users to explore and interact with the data, rather than passively viewing it. What makes a dashboard dynamic can be broken down into several key characteristics and design principles:
1. Real-Time Data Updates
What it means: A dynamic dashboard pulls and refreshes data in real time or near real time.
Why it matters:
- Allows for timely decision-making.
- Useful in scenarios like monitoring sales performance, server uptime, or customer support tickets.
- Ensures that users are always looking at the most up-to-date metrics.
Example: A network operations center dashboard that updates every 5 seconds with server statuses.
2. Interactivity
What it means: Users can interact with the dashboard—filtering, drilling down, or zooming into data subsets.
Key features include:
- Filters and selectors: Date ranges, departments, regions, product lines, etc.
- Drill-downs: Clicking a chart to see more granular detail.
- Hover states/tooltips: Displaying extra information when hovering over data points.
- Toggle views: Switching between different chart types or datasets.
Why it matters:
- Makes data exploration intuitive.
- Empowers users with different needs to self-serve insights.
Example: A sales dashboard that allows users to select a specific rep, region, or product and see how KPIs change accordingly.
3. Responsive and Adaptive Design
What it means: The dashboard adjusts based on screen size and device type.
Why it matters:
- Users often access dashboards on tablets, phones, or embedded within other apps.
- A dynamic dashboard maintains usability across different platforms.
Example: A dashboard that reorganizes components in a vertical stack on mobile but shows them side-by-side on desktop.
4. Personalized Views
What it means: Dashboards tailor themselves to the user's role, preferences, or access level.
Why it matters:
- Reduces clutter and cognitive load.
- Ensures data security and relevance.
Example: A finance manager sees budget variance KPIs, while a project manager sees task progress indicators—on the same platform.
5. Conditional Formatting and Alerts
What it means: Data elements change appearance based on defined thresholds or business rules.
Why it matters:
- Draws attention to anomalies or urgent issues.
- Enhances cognitive recognition of important metrics.
Example: A red icon next to a sales target metric that's falling behind, or a green highlight for KPIs that are outperforming expectations.
6. Integration with Multiple Data Sources (Data Mashups)
What it means: Combines data from multiple systems into one coherent view—ERP, CRM, databases, spreadsheets, APIs.
Why it matters:
- Provides context and avoids siloed analysis.
- Facilitates richer insights and storytelling.
Example: Combining customer satisfaction scores from a survey tool with support ticket resolution data to identify weak service areas.
7. Embedded Analytics and Action Triggers
What it means: Users can not only see the data but act on it from within the dashboard.
Why it matters:
- Turns the dashboard into a decision-making and action-taking interface.
- Streamlines workflows.
Example: Clicking a chart bar to open a ticket, send an email, or approve a request directly from the dashboard.
8. Time-Series and Trend Analysis
What it means: Dashboards show how metrics evolve over time, using rolling averages, forecasts, or comparison periods.
Why it matters:
- Supports strategic decision-making.
- Helps recognize patterns, seasonality, or anomalies.
Example: A line chart comparing this quarter's revenue to the same period last year with trend lines and forecasts.
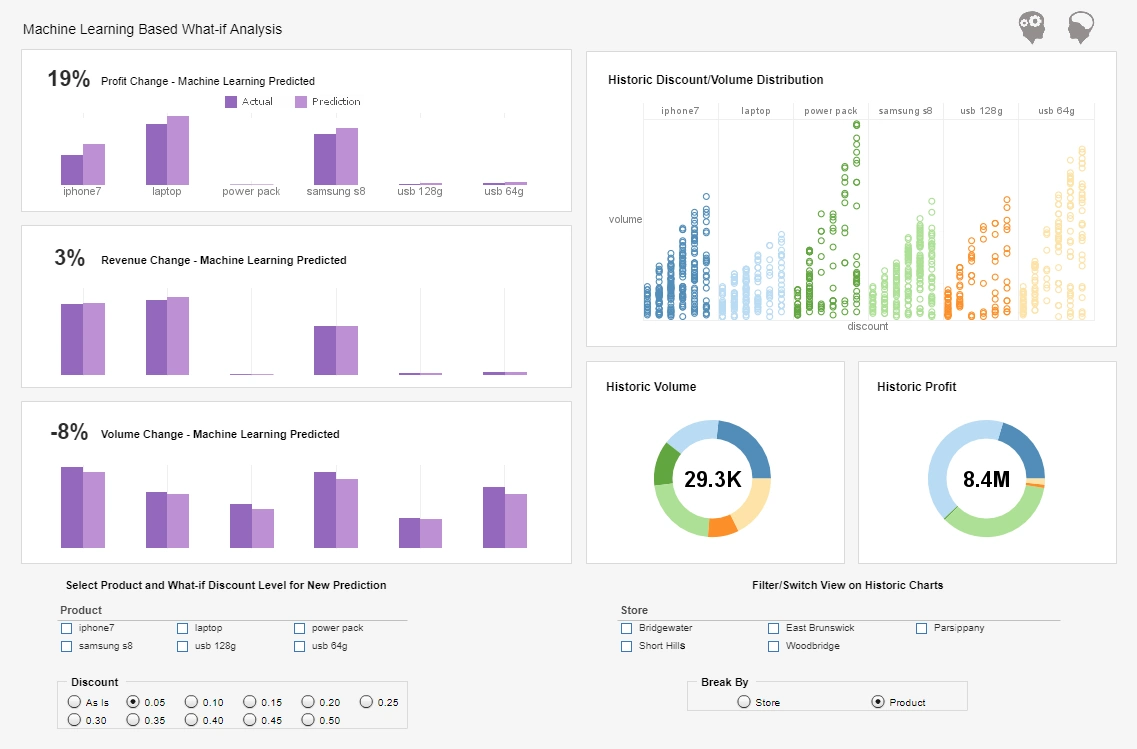
9. Embedded Machine Learning and Predictive Analytics
What it means: Integrates models that forecast, classify, or recommend actions based on patterns in the data.
Why it matters:
- Elevates the dashboard from descriptive to predictive or prescriptive analytics.
- Helps users stay ahead of the curve.
Example: A supply chain dashboard showing predicted stockouts based on current inventory and lead times.
10. User Collaboration and Sharing Features
What it means: Users can comment, annotate, or share dashboard views with others.
Why it matters:
- Encourages alignment and teamwork.
- Makes insights more accessible to non-technical stakeholders.
Example: A manager highlights a sudden dip in performance and tags a team member for follow-up, all within the dashboard.
Distributor of Abrasive Products Uses InetSoft's Open Source StyleBI to Create Dynamic Dashboards
This article explores how a mid-sized abrasive products distributor transformed its operations by adopting InetSoft's open-source StyleBI platform to create dynamic, actionable dashboards. Targeted at IT professionals, we'll delve into the technical implementation, integration challenges, and the tangible benefits realized through this powerful business intelligence (BI) tool.
Why StyleBI? Understanding the Choice of an Open-Source BI Solution
InetSoft's StyleBI is an open-source business intelligence platform designed for rapid development of analytics, dashboards, and reporting through a robust data transformation pipeline and advanced visualization capabilities. Unlike proprietary BI tools that often come with high licensing costs and rigid frameworks, StyleBI offers flexibility, scalability, and cost-effectiveness—key considerations for a distributor operating in a competitive market. For our abrasive products distributor, the decision to adopt StyleBI was driven by three primary factors:
-
Cost-Effectiveness: As an open-source solution, StyleBI eliminates the need for expensive subscriptions, allowing the distributor to allocate resources to other critical areas like inventory management.
-
Customization: The platform's open-source nature enables the IT team to tailor dashboards to specific business needs, such as tracking abrasive product categories (e.g., coated vs. bonded abrasives) or supplier performance.
-
Ease of Integration: StyleBI's compatibility with various data sources, including SQL databases, ERP systems, and cloud-based platforms, made it an ideal fit for the distributor's heterogeneous IT environment.
For IT professionals, StyleBI's appeal lies in its lightweight architecture and support for modern web technologies, enabling seamless deployment on existing infrastructure with minimal overhead.
Technical Implementation: Building the Dashboard Infrastructure
The distributor's IT team embarked on implementing StyleBI to create dashboards that provide comprehensive insights into production, inventory, sales, and marketing, as highlighted by InetSoft's capabilities. Here's a breakdown of the technical process:
1. Data Source Integration
The distributor's data ecosystem included an ERP system (e.g., SAP Business One), a SQL Server database for inventory and sales data, and Excel-based reports for supplier metrics. StyleBI's data transformation pipeline was leveraged to integrate these disparate sources. The IT team used JDBC connectors to link the SQL Server database and configured ODBC connections for Excel data. For the ERP system, StyleBI's API-based connectors facilitated real-time data extraction.
A key challenge was ensuring data consistency across sources. The team implemented a data cleansing process using StyleBI's built-in ETL (Extract, Transform, Load) tools to normalize data formats, remove duplicates, and handle missing values. For example, abrasive product SKUs were standardized to ensure accurate tracking across inventory and sales dashboards.
2. Dashboard Design and Visualization
StyleBI's drag-and-drop interface allowed the IT team to design dynamic dashboards without extensive coding. The team created role-based dashboards tailored to different stakeholders:
-
Inventory Managers: Dashboards displaying real-time stock levels, reorder alerts for high-demand abrasives (e.g., diamond grinding wheels), and supplier lead times.
-
Sales Team: Visualizations showing sales trends by product category, customer demographics, and regional performance.
-
Executives: High-level KPIs, such as gross margin, inventory turnover rates, and year-over-year sales growth.
The dashboards utilized StyleBI's advanced visualization components, including heatmaps for regional sales distribution, line charts for inventory trends, and pie charts for product category breakdowns. For instance, a heatmap highlighted that 60% of coated abrasive sales were concentrated in the Midwest, enabling targeted marketing campaigns.
3. Real-Time Data Processing
To ensure real-time insights, the IT team configured StyleBI's data refresh schedules to pull updates from the ERP system every 15 minutes. This was critical for inventory dashboards, as abrasive products often have short shelf lives due to market demand fluctuations. The team used StyleBI's caching mechanisms to optimize performance, reducing query latency on the SQL Server database by 40%.
4. Security and Access Control
Security was a top priority, given the sensitive nature of sales and supplier data. The IT team implemented role-based access control (RBAC) within StyleBI, ensuring that only authorized users could view specific dashboards. Single Sign-On (SSO) integration with the company's Active Directory streamlined user authentication, while data encryption ensured compliance with industry standards like GDPR for European customers.
Challenges and Solutions
The implementation wasn't without hurdles. The IT team encountered the following challenges:
-
Data Silos: Disparate data sources led to inconsistencies in reporting. The team addressed this by creating a centralized data warehouse using PostgreSQL, which served as a single source of truth for StyleBI dashboards.
-
User Adoption: Non-technical users, such as sales reps, initially struggled with interpreting dashboards. The IT team conducted training sessions and created user-friendly documentation, emphasizing StyleBI's intuitive interface.
-
Performance Bottlenecks: High data volumes caused slow dashboard load times. The team optimized SQL queries and implemented indexing on the database, reducing load times from 10 seconds to under 3 seconds.
These solutions highlight the importance of aligning BI tools with existing IT infrastructure and user needs, a critical consideration for IT professionals evaluating StyleBI.
Benefits Realized
The adoption of StyleBI yielded significant benefits for the distributor, demonstrating the power of open-source BI for niche industries:
-
Improved Decision-Making: Real-time dashboards enabled faster responses to market changes. For example, when a supplier delayed delivery of bonded abrasives, the inventory team used StyleBI's reorder alerts to source alternatives, preventing stockouts.
-
Cost Savings: By leveraging open-source software, the distributor avoided $50,000 in annual licensing fees compared to proprietary BI tools like Tableau or Power BI.
-
Enhanced Collaboration: Role-based dashboards fostered collaboration between departments. Sales and inventory teams could align strategies based on shared insights, such as prioritizing high-margin abrasive products.
-
Scalability: StyleBI's lightweight architecture allowed the distributor to scale dashboards as the business grew, adding new data sources like a CRM system without significant rework.
For IT professionals, these benefits underscore StyleBI's value in delivering enterprise-grade BI without the complexity or cost of traditional platforms.
Technical Insights for IT Professionals
For IT teams considering StyleBI, the following technical insights are critical:
-
Deployment Options: StyleBI can be deployed on-premises or in the cloud. The distributor chose an on-premises deployment to maintain control over sensitive data, using a Linux server with Apache Tomcat for hosting.
-
Customization with JavaScript: StyleBI supports JavaScript for custom visualizations. The IT team used JavaScript to create a custom gauge widget for monitoring inventory health, enhancing dashboard interactivity.
-
Performance Optimization: Indexing databases and leveraging StyleBI's caching are essential for handling large datasets. The team also used asynchronous data loading to improve user experience.
-
Community Support: As an open-source tool, StyleBI benefits from a vibrant community. The IT team resolved integration issues by consulting forums and GitHub repositories, reducing dependency on external consultants.


