InetSoft Product How-To: Formatting Dashboards
The ‘Format’ dialog box provides options for changing the visual appearance of elements and their representation of data. To open the ‘Format’ dialog box, right-click on a component and select ‘Format’ from the context menu.
Certain components have multiple regions that can be selected and formatted independently. For example, a component title bar can always be formatted independently of the component body.
To format a particular region of a component, right-click on the desired region, and select ‘Format’ from the context menu. To format the general component (rather than a particular region), first make sure the component is entirely deselected. Then right-click to select the general component (not a region), and choose ‘Format’ from the context menu.
The ‘Format’ dialog box contains the following tabs:
1. The Format tab allows you to specify a data format. Formatting is available for the following data types: Date, Number, Currency, Text, Percent.
2. The Alignment tab settings determine the horizontal and vertical alignment of component text.
3. The Font tab allows you to specify the font face (Arial, Serif etc.), the style (bold, italic), and the size of the font used for component text.
4. The Border tab allows you to set border thickness and color for components.
5. The Color tab allows you to set text color, background color, and transparency for components.
6. The CSS tab allows you to specify a CSS class to style the visual properties of a component. You can style individual regions of a component independently, just as with manual formatting.
What Would the Developer of Deviation Management Software Put on a Dashboard?
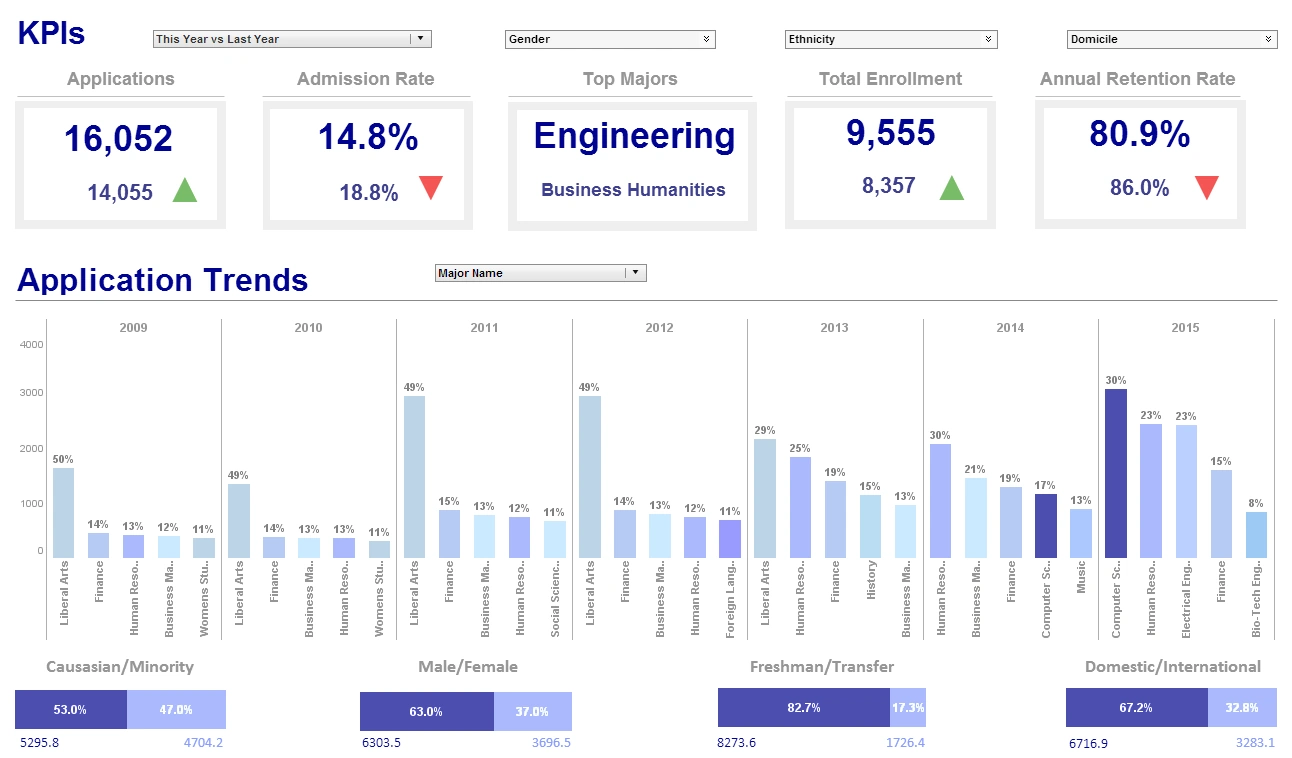
The dashboard for Deviation Management Software serves as a central hub for users to monitor, analyze, and manage deviations from established processes, standards, or requirements within an organization. It provides real-time visibility into deviations, their status, impact, and resolution progress. Here are several key components and metrics that the developer might include on the dashboard:
- Deviation Overview:
- A summary of total deviations logged within a specified time period.
- Breakdown of deviations by category (e.g., quality, safety, regulatory) or department.
- Trend analysis showing the number of deviations over time.
- Deviation Status:
- Distribution of deviations by status (e.g., open, in progress, closed).
- Aging analysis displaying the duration of open deviations to identify overdue items.
- Severity and Impact:
- Categorization of deviations by severity level (e.g., minor, moderate, major).
- Analysis of deviations by potential impact on operations, compliance, or customer satisfaction.
- Root Cause Analysis:
- Breakdown of deviations by root cause (e.g., human error, equipment malfunction, process failure).
- Trends in root causes to identify recurring issues and areas for improvement.
- Resolution Progress:
- Status of corrective and preventive actions (CAPAs) associated with deviations.
- Timeline or Gantt chart showing the progress of CAPA implementation and closure.
- Responsibility Assignment:
- Allocation of deviations to responsible individuals or departments.
- Performance metrics tracking response times and completion rates for assigned tasks.
- Compliance and Audit Readiness:
- Adherence to regulatory requirements, standards, and internal policies.
- Alerts for deviations that pose compliance risks or require escalation.
- Trend Analysis and Benchmarking:
- Comparative analysis of deviations across different locations, teams, or product lines.
- Benchmarking against industry standards or historical data to assess performance.
- User Engagement and Feedback:
- Feedback mechanism for users to report deviations, provide comments, or suggest improvements.
- User satisfaction ratings or surveys to gather feedback on the usability and effectiveness of the software.
- Customization and Personalization:
- Customizable widgets and filters to tailor the dashboard to specific user roles, preferences, or organizational needs.
- Role-based access control to ensure data confidentiality and security.
How Is Deviation Management Is Important for GMP Compliance?
Deviation management is a crucial aspect of Good Manufacturing Practice (GMP) compliance in the pharmaceutical, biotechnology, and related industries. It involves identifying, documenting, investigating, and resolving deviations from established procedures, standards, and specifications in manufacturing processes. Effective deviation management is essential for ensuring product quality, safety, and regulatory compliance. Here's an in-depth look at why deviation management is important for GMP compliance and how it contributes to the overall quality management system.
1. Understanding Deviation Management
a. Definition of a Deviation:
A deviation refers to any departure from an approved procedure, standard, or expectation within a GMP-regulated environment. This can include unplanned changes in manufacturing processes, equipment malfunctions, raw material discrepancies, human errors, or deviations in testing and analytical methods.
b. Deviation Management Process:
Deviation management involves the following steps:
- Identification and Reporting: Any observed deviation is documented and reported immediately.
- Categorization: Deviations are categorized based on their impact—major, minor, or critical—depending on the potential risk to product quality or patient safety.
- Investigation: A root cause analysis is conducted to determine the underlying cause of the deviation.
- Impact Assessment: An evaluation is made to assess the impact of the deviation on product quality, safety, and regulatory compliance.
- Corrective and Preventive Actions (CAPA): Based on the investigation findings, CAPAs are developed and implemented to address the root cause and prevent recurrence.
- Documentation and Closure: The deviation and associated CAPAs are documented in detail, and the deviation is formally closed once all actions are completed and verified.
2. Importance of Deviation Management for GMP Compliance
a. Ensures Product Quality and Safety:
The primary objective of GMP is to ensure that products are consistently produced and controlled according to quality standards. Deviations from established procedures can lead to product defects, contamination, or inconsistent quality. Effective deviation management helps in identifying and addressing these issues promptly, thereby ensuring that only safe and effective products reach the market.
b. Maintains Regulatory Compliance:
Regulatory agencies like the FDA, EMA, and WHO require strict adherence to GMP standards. Deviation management is a key component of these standards. Regulators expect companies to have a robust system in place to document, investigate, and resolve deviations. Failure to properly manage deviations can lead to regulatory citations, warning letters, product recalls, and even facility shutdowns.
c. Facilitates Continuous Improvement:
Deviation management is not just about compliance; it is also a tool for continuous improvement. By systematically investigating deviations and implementing CAPAs, organizations can identify systemic issues, improve processes, and enhance overall operational efficiency. This proactive approach helps in reducing the occurrence of deviations over time.
d. Reduces Risk of Product Recalls:
Unresolved or poorly managed deviations can result in defective products being released to the market, which can lead to product recalls. Recalls are costly and can damage a company's reputation. Effective deviation management ensures that potential risks are identified and mitigated before products are distributed.
e. Enhances Audit Readiness:
During GMP audits, regulatory inspectors thoroughly review deviation management practices. A well-documented and consistently applied deviation management system demonstrates a company's commitment to quality and compliance. It provides auditors with confidence that the organization is capable of detecting and addressing issues effectively.
3. Key Elements of Effective Deviation Management
a. Timely Identification and Reporting:
Employees must be trained to recognize and report deviations promptly. Delayed reporting can complicate the investigation and may result in non-compliance. A culture of openness and accountability is essential for effective deviation management.
b. Comprehensive Investigation and Root Cause Analysis:
Investigating the root cause of a deviation is critical to preventing recurrence. Techniques such as the "5 Whys" and Fishbone (Ishikawa) diagrams are commonly used to identify root causes. The investigation should be thorough, considering all potential factors, including human error, equipment malfunction, procedural gaps, and environmental conditions.
c. Impact Assessment and Risk Management:
Assessing the impact of a deviation is necessary to understand its potential effect on product quality and patient safety. This assessment should consider the stage of production, the nature of the deviation, and the characteristics of the affected product. Based on the impact, the deviation can be classified as minor, major, or critical, and appropriate actions can be taken.
d. Corrective and Preventive Actions (CAPA):
The CAPA process is integral to deviation management. Corrective actions address the immediate issue, while preventive actions are aimed at eliminating the root cause to prevent future occurrences. CAPAs should be specific, measurable, achievable, relevant, and time-bound (SMART).
e. Documentation and Traceability:
All steps in the deviation management process must be thoroughly documented. This includes the initial deviation report, investigation findings, impact assessment, CAPAs, and verification of CAPA effectiveness. Documentation provides traceability and is critical for demonstrating compliance during audits.
f. Training and Awareness:
Continuous training is essential to ensure that all employees understand the importance of deviation management and are capable of identifying and reporting deviations. Training should also cover the use of deviation management systems and tools.
4. Challenges in Deviation Management
a. Incomplete Investigations:
One of the common challenges is conducting incomplete or superficial investigations. This can lead to ineffective CAPAs and recurrence of the same deviation. Root cause analysis must be comprehensive and consider all potential contributing factors.
b. Delayed Reporting and Closure:
Delays in reporting deviations or closing them out can signal to regulators that there are issues with the deviation management system. Organizations must establish timelines for reporting, investigating, and resolving deviations to maintain compliance.
c. Inadequate CAPA Implementation:
If CAPAs are not implemented effectively, the root cause of deviations remains unaddressed, leading to repeated issues. CAPA implementation should be monitored closely, and the effectiveness of CAPAs should be verified to ensure they are achieving the desired outcomes.
d. Data Management and Integration:
Managing large volumes of deviation data can be challenging, particularly for organizations with multiple manufacturing sites. An integrated quality management system (QMS) can help in tracking deviations, managing CAPAs, and generating reports for trend analysis.
5. Role of Technology in Deviation Management
a. Electronic Quality Management Systems (eQMS):
eQMS platforms streamline deviation management by providing a centralized system for reporting, tracking, and resolving deviations. These systems facilitate workflow automation, ensure timely escalation of critical deviations, and provide comprehensive audit trails.
b. Data Analytics and Reporting:
Advanced analytics can be applied to deviation data to identify trends, recurring issues, and areas for improvement. Dashboards and automated reports provide real-time insights into deviation management performance and help in decision-making.
c. Integration with Other Systems:
Integration of the deviation management system with other business systems, such as ERP (Enterprise Resource Planning) and LIMS (Laboratory Information Management Systems), enhances data sharing and process coordination, improving overall efficiency and compliance.


