Generating Business Value Via BI | InetSoft Technology
 InetSoft helps generate more revenues, obtain better customer service and achieve higher profit margins because it provides total visibility into the business. It delivers tailored information in the quickest, most relevant manner possible so each user has actionable information to meet their specific business objectives.
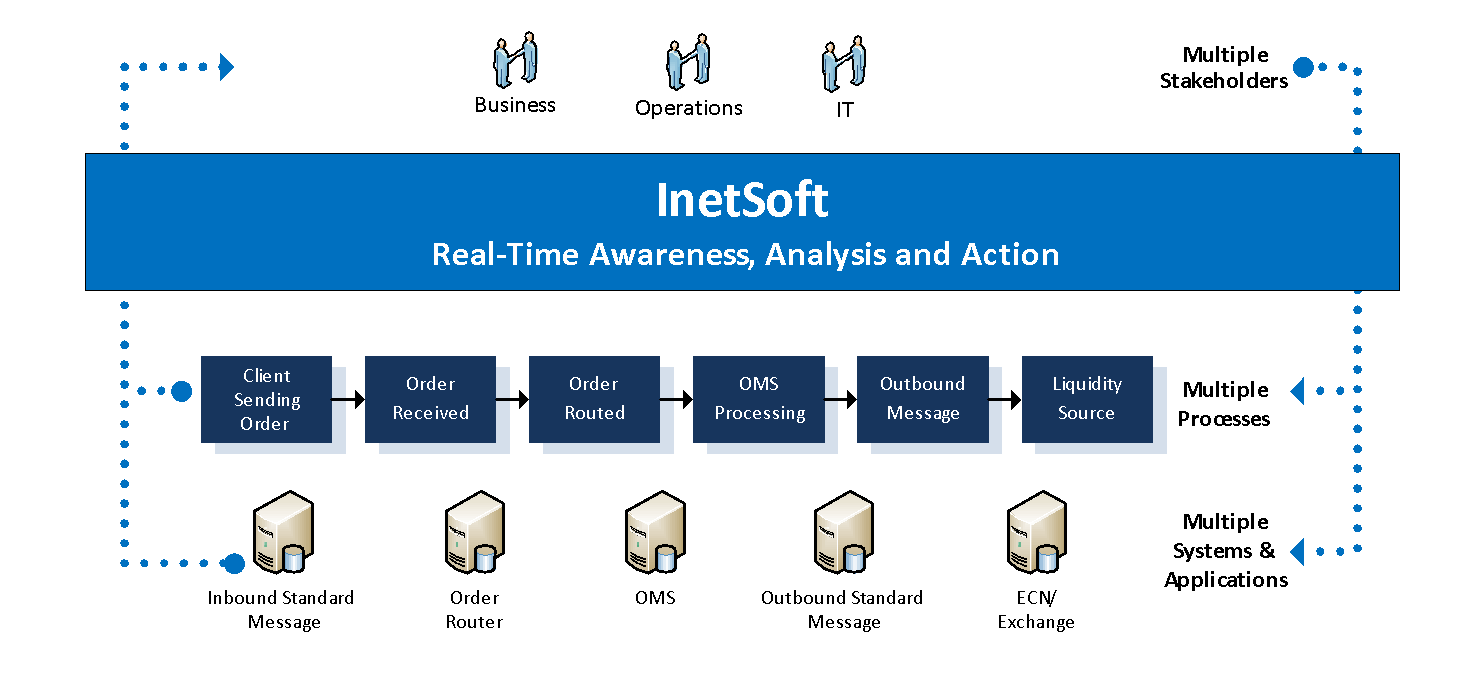
Mission critical information left untouched is meaningless. As mentioned earlier, InetSoft provides a framework allowing users to define their business data in business terms, versus IT application or system names. For instance, when brokers receive an order from a counterparty, they can name the process step “Order Received.” An end user can now see the process step on the dashboard, represented in a familiar term instead of an unrecognizable IT or system name. In addition, the “Order received” step is usually a farm of servers that processes high volumes of incoming orders. With the correlation and aggregation capabilities of InetSoft, all orders come together as a single item on the dashboard.
The InetSoft technology also helps you manage the business, based on the definitions and measurements of Key Performance Indicators (KPIs). When you define these KPIs, you can set performance thresholds based on the business strategy for the trading day. When a threshold is crossed, real-time visual alerts signal stakeholders to a potential problem or opportunity so users can take immediate action to affect that day’s performance.
 |
View a 2-minute demonstration of InetSoft's easy, agile, and robust BI software. |
For example, if you build a metric called “Hit Ratio,” (number of accepted trades divided by the number of requests for quotes) you could establish a KPI around an acceptable value to be maintained. The Data Mashup Engine calculates the “Hit Ratio” throughout the trading day. The KPI itself can be seen on the dashboard and can be customized as a line-graph, bar-graph, or pie-chart. The end user can receive alerts on the dashboard, in an email, as a pop-up message in the workstation system tray (like an Outlook incoming email message), or any combination of these. Based on the alert, the user then decides the correct action. He might widen his pricing spreads if the ratio is too high (gaining a better pricing margin) or he might tighten his pricing spreads if the ratio is too low (increasing acceptance volume).
InetSoft’s flexibility also helps you determine root cause of problems in a number of ways. You could drill into the KPI, view the underlying data making up the KPI and regroup and repurpose the data by geography to determine if the problem is localized. You could also regroup the data by trading desk or by trader names to determine if a particular trading desk or trader is not performing up to par.