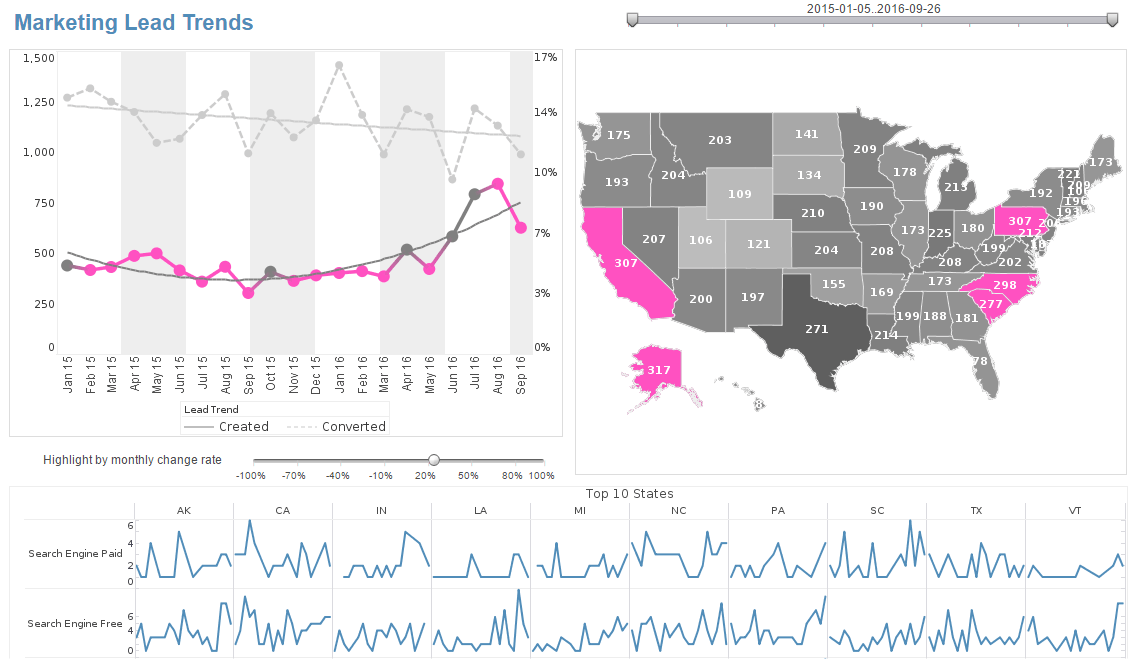
Keep Your Marketing Dashboard Simple
This is the continuation of the transcript of a webinar hosted by InetSoft on the topic of "The Value of Marketing Executive Dashboards"
Another bit of advice is really to keep your marketing dashboard simple. Keep it clean. Everything should be made as simple as possible but not simpler. That's a famous quote by Albert Einstein which I really love. The truth is that simple is actually pretty hard to do. Producing something simple people might not realize the work that goes into that because it actually is harder than producing something with a whole bunch of bling.
Avoid the eye candy, avoid the flash, and the 3D elements. Avoid the gadgets. All of this kind of stuff makes it harder to understand your data. It's harder to read your data when you have a lot of decorative elements that don't contribute to the meaning of your data or the purpose of what you're trying to discover.
Simple is not just anti-clutter though. Here's a dashboard that just has a bunch of tables. Now that could be useful at some point, but really for an executive you just don't expect an executive to be able to look at this and pull information out of it. There might be a use for this but not necessarily for your executive. Simple is something that's pretty darn straightforward.
| #1 Ranking: Read how InetSoft was rated #1 for user adoption in G2's user survey-based index | Read More |
Pretty Basic Dashboard
Here's a pretty basic dashboard, pretty straightforward about sales by customer location. It's also got sales by product category, and sales by customer segment. You can see that it has further capability for me to filter. In fact I got this one live where I can show you, I can actually scroll right through different quarters and see activity. I can fix certain categories. I can choose furniture, for example, if I really want to focus on furniture and see what's happening in terms of sales and profitability.
I can do all kinds of things here, and I can quickly figure out, well, what is furniture doing in small business segments. Let's get rid of all these tags. Well, right away I'm able to see some activity in terms of furniture, and I can see that for the small business segment it is pretty largely unprofitable. So we see profit with blue bars here coming through and see more profit and frankly see sales going up, so that's this one.
The fourth point of advice I have for you, and I know I'm moving pretty quickly here, is to tell a story that leads to action. Storytelling is the most powerful way for you to put ideas into the world today, and the point of putting ideas in the world today is to get things changed, to get people exposed to new things so that they can realize how they contribute or how they can participate in what you're offering.
So, tell the story. Think about your data in terms of how it tells a story. Stories are going to help us because what they do is they dispel myth, and I know for a lot of us there's a lot of myth making that happens around marketing. Sometimes what we do in our business it's not just going point A to point B. It's not a straight line. We have to work with consumers, and businesses, and people, that sometimes behave irrationally. Some of our campaigns don't have the intended effects or people hear a story about how your customer did something or didn't understand something and myths start to emerge and start to get to be treated as facts.
 |
Read the top 10 reasons for selecting InetSoft as your BI partner. |
Use Data and Stories
But when you use data and stories and you show and you explain you can dispel those myths. You can also stop hiding from problems. Stories can help make solve problems such as, maybe sales are down, or your campaigns are not as responsive. That's a problem that you want to solve, but it's also like "uh, do I really want to know?"
But a story to uncover why that campaign is not performing, who is the target, what's the conflict that you're having in the campaign, what's the drama, who are the protagonists, what's happening with the story of your campaign, and the data that unveils that story can help you look at the problem in a new way and stop hiding from it and start looking at it as an opportunity.
That also helps us answer questions on the spot. Being able to just say that 32% of our customers do something is one thing, being able to say I was talking to some customers the other day or saw this pattern, and here's what's happening. One in three people is doing this. The reason why they're doing it is because we executed this campaign.
Being able to bring the human element into your data, the storytelling is a great way to bring it to life for all kinds of different people that you work with internally. And then stories also help us drive to the truth. They help people understand and create common understanding about facts so that we can again avoid those myths and focus on the truth. Focus on the facts.
Put the facts, in essence, at the center of the table, and talk about what we can do about it. So, it helps us further along getting to the root of the problem, understanding what's happening and getting to what would like be some good solutions to solve that. The storytelling and being able to use data in a story like way is a good thing.
| Previous: Advice for Creating Marketing Dashboards |


