Manipulating Data Blocks with a BI Tool
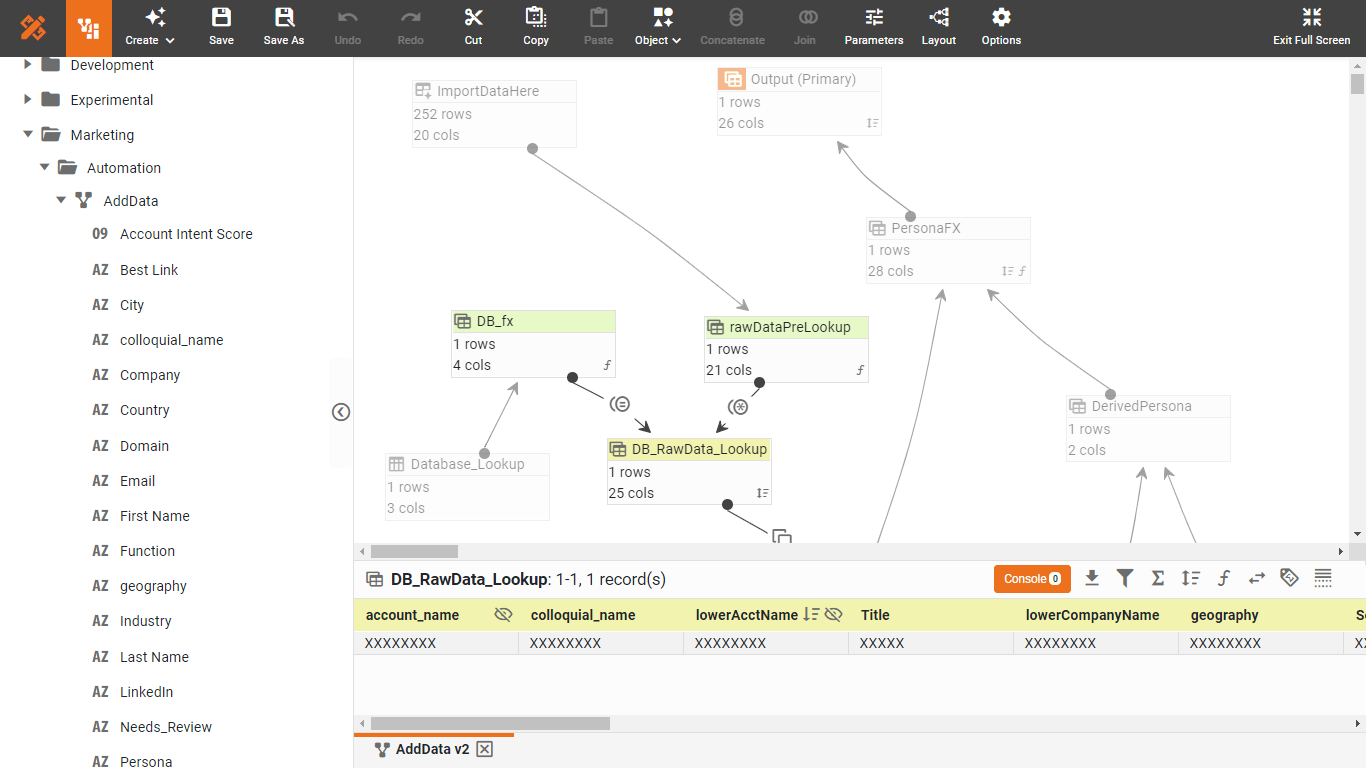
InetSoft's BI Tool has a data manipulation layer called Worksheets. They provide an array of sophisticated data manipulation tools, including joins, filters, and concatenations. In the example below, you will now use some grouping and aggregation tools to manipulate the Data Block that you created earlier in Constructing Data Blocks.
- Right-click on the table’s top row and select ‘Group and Aggregate’ from the drop-down menu. This will open the ‘Aggregate’ dialog box.
- In the ‘Aggregate’ dialog box, make the following selections:
- For the ‘Order.Date’ field, select the ‘Group’ checkbox and select ‘Month’ from the drop-down list.
- For the ‘Product.Total’ field, select the ‘Aggregate’ checkbox and choose ‘Sum’ from the drop-down list.
- Click ‘OK’ to exit the ‘Aggregate’ dialog box. The grouping you specified is applied to the ‘Date’ and ‘Total’ columns of the table. The ‘Category’ column is hidden because no grouping options were specified for it.
Data Worksheet assets can be created and modified both by the desktop Asset Composer, and the webbased Visual Composer.
| #1 Ranking: Read how InetSoft was rated #1 for user adoption in G2's user survey-based index | Read More |
Saving Data Blocks
After you have created and manipulated a Data Block, you can save this asset to the Asset Repository, where it will be available for use in reports, Viewsheets, and other Worksheets.
- Click the ‘Save As’ button in the top toolbar to open the ‘Save Worksheet’ dialog.
- Enter the name “SampleAsset” in the ‘Name’ text box, select ‘Global’ scope, then click ‘OK’.
The asset is saved and appears in the Asset Repository under the ‘Global’ node.
There are many further manipulations you can make to the data in this table. See Manipulating Tabular Data in the Data Worksheet Guide for full details.
| Previous: Data Manipulation & Mash-up |
Next: Visual Exploration
|


