Using InetSoft for Multidimensional Analysis on OLAP Databases
Since 1996 InetSoft has been offering business intelligence applications that are flexible and powerful, serving over 5,000 enterprises and solution providers worldwide.
OLAP overlay is an optional component of the data model that provides flexible ways to dynamically group, aggregate, and display summary information. This is often called “slice-and-dice.”
Unlike star schema relational databases and multi-dimensional databases, ER schema databases do not have a physical schema that readily supports OLAP functions.
The Data Modeler provides a light weight, logical mapping tool called OLAP overlay to allow direct slice-and-dice on ER schema data. For end users, this component of the data model is accessed through the OLAP analysis interface.
Evaluate InetSoft for your OLAP analysis solution


Design Concepts
Dimensions are the descriptive parameters for measures that can be used to filter and group. For example, ‘purchase date’, ‘ship date’, ‘product’ and ‘sale location’ are all possible dimensions for orders.
Dimensions also often form natural hierarchies, i.e., a product belongs to a category.
Star schemas physically organize measures and dimensions into fact tables and dimension tables, respectively. A large fact table sits in the center. Small dimension tables are joined to the fact table through one-level joins.
This organization allows for the selection of a dynamic combination of dimensions, for a wide array of measures. A range of operations can be easily performed by the end user via a properly designed user interface:
- drill-down – go to a lower level in the dimension hierarchy
- drill-up – go to a higher level in the dimension hierarchy
- drill-by – replace one dimension with another not currently displayed
- drill-through – show the underlying detail data
- drill-across – change to a different value for a dimension
- 80/20 analysis – display the top or bottom 80% or 20% of the rows
These operations allow the end user to quickly slice-and-dice the data for high-level analysis.
Designing OLAP Overlays
The InetSoft logical model is the base used to construct a virtual cube. The OLAP overlay organizes attributes from the logical model into dimensions and measures. Moreover, the OLAP overlay provides the ability to organize attributes into hierarchies for drill operations.
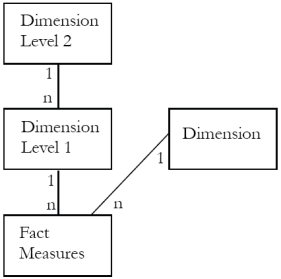
Careful consideration should be given to designing a properly formed OLAP overlay, in order to avoid traps. The relationships between dimensions and measures, and between attributes within a dimension, should have the cardinality pattern shown below:
This cardinality pattern will ensure that aggregation performed by end users gives correct results.
Continued: Creating a Hierarchical OLAP Overlay