InetSoft Delivers a Big Data BI Solution Adding a Hadoop Connector in New Release
User interface refresh accompanies host of advanced visualization design features
Piscataway, NJ – September 17, 2013 – InetSoft Technology, an innovator in mashup-driven dashboard and reporting solutions, announced a new release of its business intelligence platform Style Intelligence, version 11.5. Headlining the enhancements is a new data source connector for the Apache Hive data warehouse system for Hadoop so that dashboards, visual analyses, and data mashups can be made as easily as with any enterprise data source.
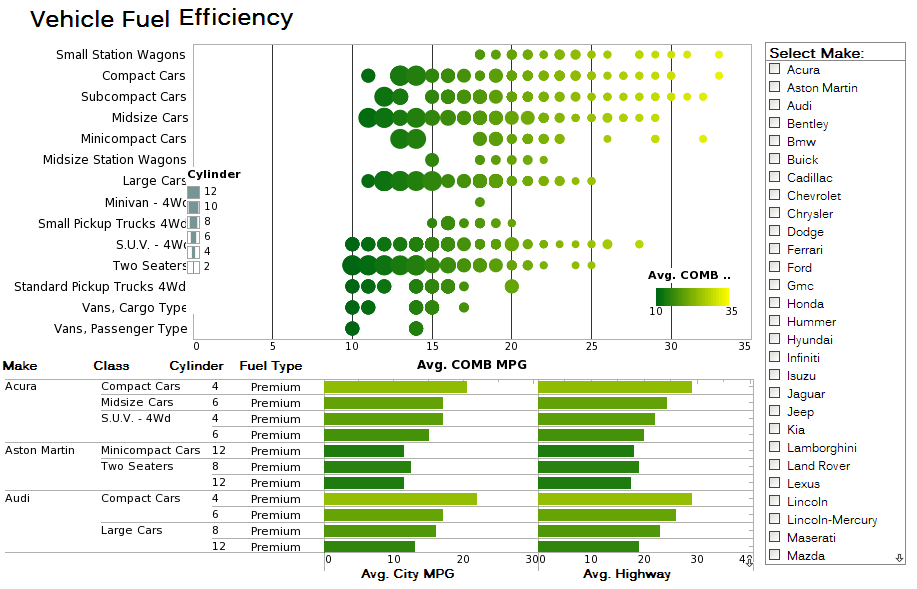
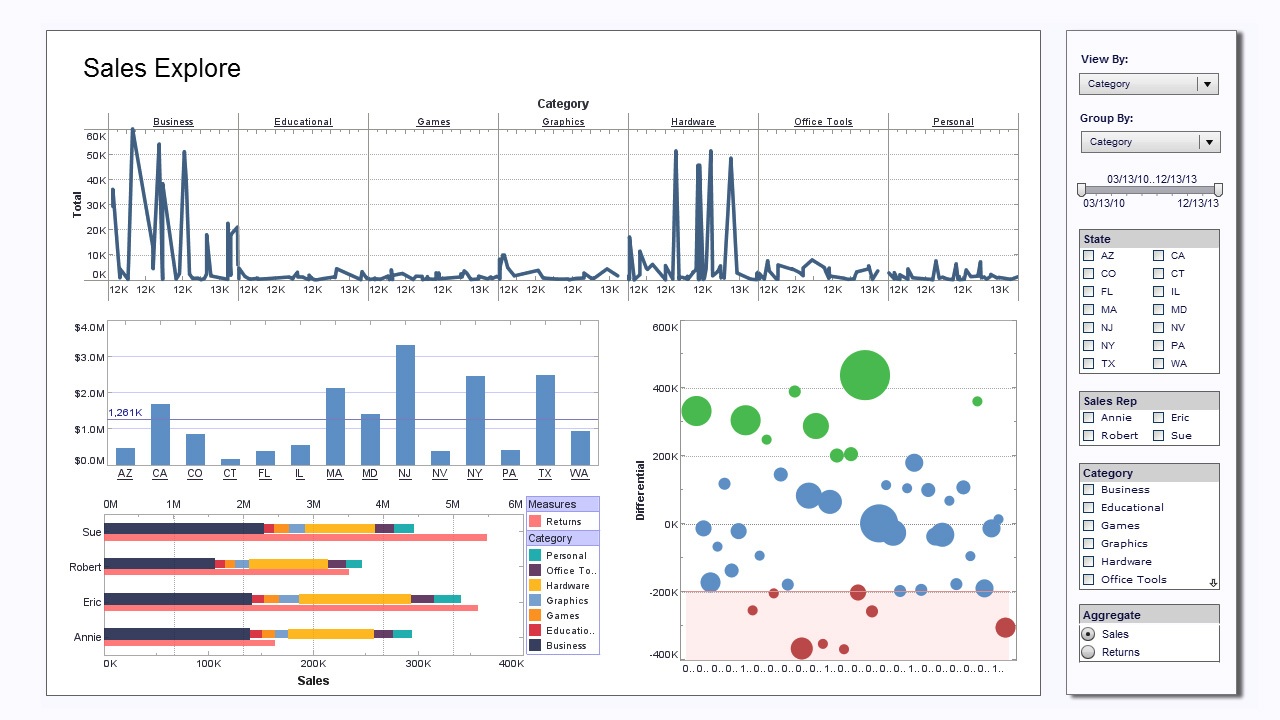
The most noticeable improvement for this release is a user interface refresh that reflects the clean, modern design style more commonly found in today’s Web-based applications. A long list of dashboard and visualization design-oriented features accompany this release, and a couple of examples are: automatic resizing with browser window-size and adding statistics-driven chart lines over data for things like upper and lower bands, percentiles, and confidence intervals. For IT administrators, new features include additional audit reports, greater control over administrative functions based on user, group, and role, and the ability to enable even more self-service for end-users, who can now schedule report and dashboard snapshot emailing on their own.
Mark Flaherty, CMO of InetSoft, comments “Besides a cosmetic refresh of our user interface and meeting the market’s demand for more big data connectivity, the driving theme of this release was to build on our position of offering the most IT-friendly implementation of self-service business intelligence. This has been a major win factor for us once the end-user community is satisfied with the dashboarding and analytics capabilities. The people who need to deploy and support the solution gravitate to us because they find the application easy to set up through the evaluation process, and they see the power of the breadth of customization capabilities from portal embedding to programmatic control of asset generation.”
Style Intelligence is a full-featured business intelligence solution for dashboard reporting that includes a powerful data mashup engine. End-users get visually compelling, highly interactive access to data, and IT gets a highly customizable, easy to learn and quick to deploy business intelligence toolset and information delivery platform. Data mashup capabilities allow for the integration of disparate data sources, enabling agile development and providing maximum self-service, while the application's SOA architecture and open standards-based technology make for an ideal embedding and integration-ready application for dashboards, production reporting, and visualization.
To view a demo, manipulate live interactive displays, or read customer reviews of InetSoft's advanced business intelligence software, please visit http://www.inetsoft.com/evaluate.
About InetSoft
Since 1996 InetSoft has been delivering easy, agile, and robust business intelligence software that makes it possible for organizations and solution providers of all sizes to deploy or embed full-featured business intelligence solutions. Application highlights include visually-compelling and interactive dashboards that ensure greater end-user adoption plus pixel-perfect report generation, scheduling, and bursting. InetSoft’s patent pending Data Block™ technology enables productive reuse of queries and a unique capability for end-user defined data mashup. This capability combined with efficient information access enabled by InetSoft’s visual analysis technologies allows maximum self-service that benefits the average business user, the IT administrator, and the developer. InetSoft solutions have been deployed at over 3,000 organizations worldwide, including 25% of Fortune 500 companies, spanning all types of industries.
Contact
For more information, media and analysts may contact:
Mark Flaherty
InetSoft Technology Corp.
+1.732.424.0400 x 936
mark.flaherty@inetsoft.com
www.inetsoft.com
Quotable
“...the driving theme of this release was to build on our position of offering the most IT-friendly implementation of self-service business intelligence. This has been a major win factor for us...”
Visualization Examples

