The Report Functions of StyleBI
StyleBI is a business intelligence and reporting platform designed to handle the full analytics lifecycle, from raw data access to interactive dashboards and operational reporting. Its core strength lies in flexibility.
Instead of forcing data teams into rigid schemas or predefined models, StyleBI focuses on letting organizations shape analytics around real workflows. The functions below cover how the platform supports data integration, analysis, visualization, and distribution at scale.


Data Connectivity and Integration
One of the foundational functions of StyleBI is broad data connectivity. The platform connects to relational databases, cloud data warehouses, big data platforms, APIs, and flat files. This includes traditional SQL databases, modern cloud-native systems, and semi-structured sources such as JSON or CSV files.
StyleBI allows teams to work directly against live data sources or cached data depending on performance and governance needs. This flexibility makes it possible to support both real-time operational dashboards and heavy analytical workloads without duplicating data unnecessarily.
Data Mashup and Transformation
A defining function of StyleBI is its ability to mashes up data from multiple sources without requiring a separate ETL pipeline. Users can combine tables from different systems, apply joins, filters, calculations, and aggregations, all within the platform.
This data mashup capability reduces dependency on engineering teams for every schema change. Business analysts can shape datasets as requirements evolve, which shortens iteration cycles and keeps reporting aligned with actual business questions.
Semantic Layer and Logical Modeling
StyleBI provides a semantic layer that sits between raw data and end-user reports. This layer defines metrics, dimensions, hierarchies, and business logic in a consistent way. Once defined, these concepts can be reused across dashboards, reports, and self-service analysis.
The semantic layer ensures that key metrics are calculated consistently across departments. Revenue, churn, utilization, or operational KPIs follow the same definitions regardless of who builds the report, reducing confusion and metric drift.
Self-Service Reporting
Self-service reporting is a core function of StyleBI. Users can build their own reports using drag-and-drop tools, selecting fields from governed data models rather than writing raw queries. This lowers the barrier to entry for non-technical users while still respecting data access rules.
At the same time, advanced users retain the ability to write custom SQL or expressions when needed. This balance between simplicity and power allows organizations to support a wide range of skill levels on a single platform.
Interactive Dashboards
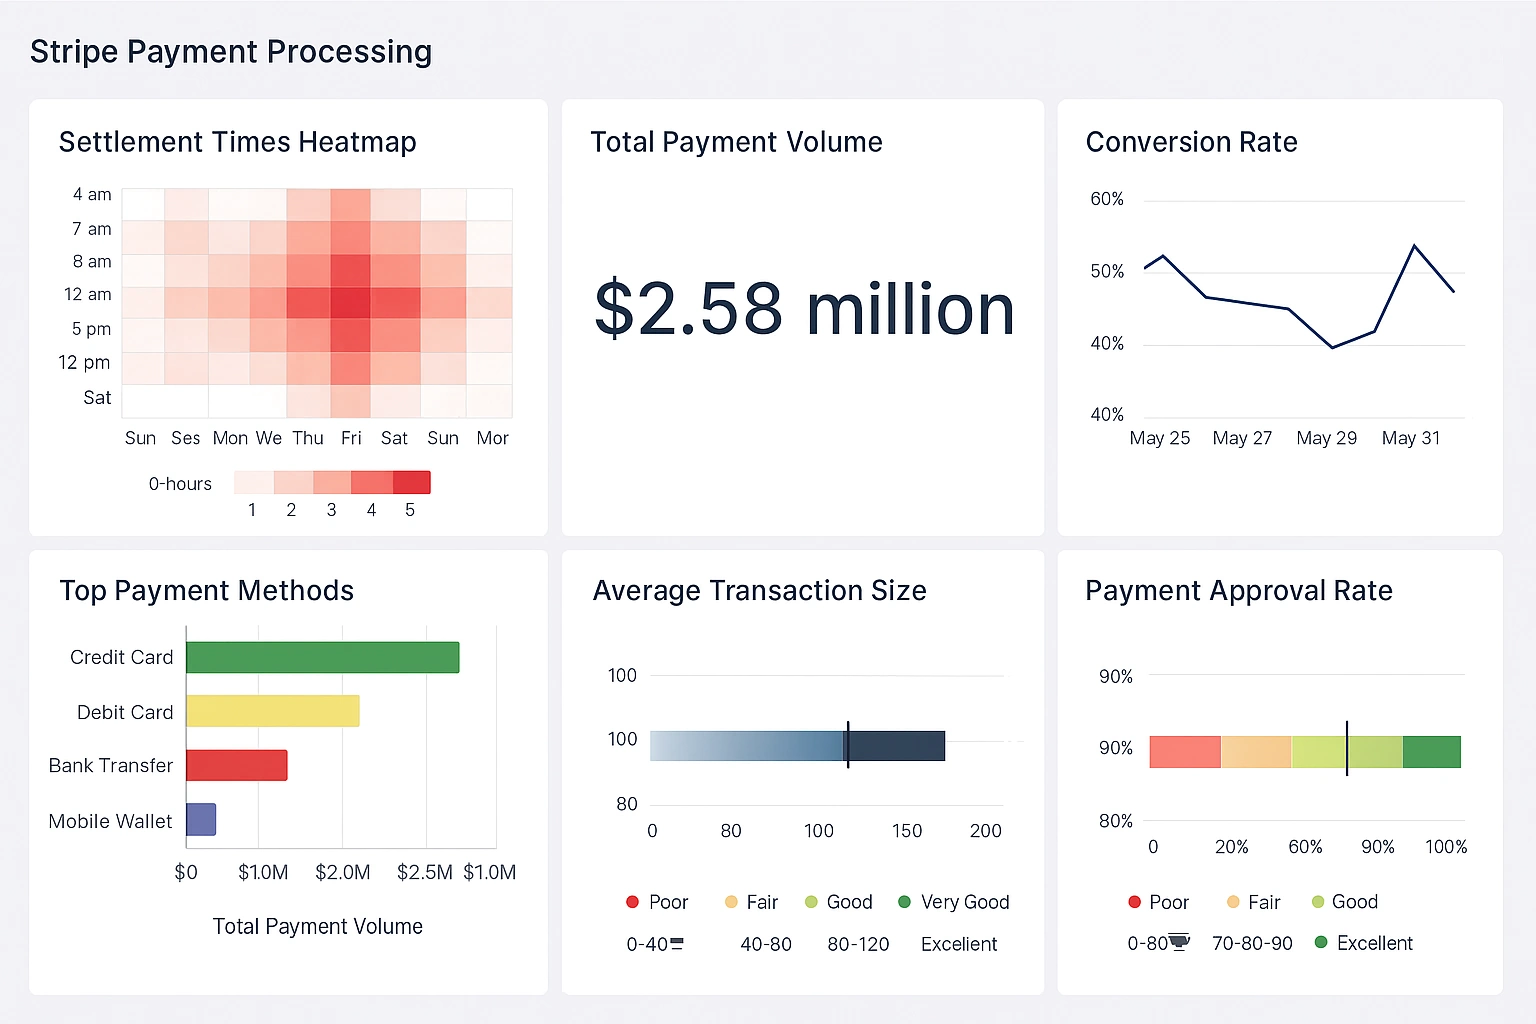
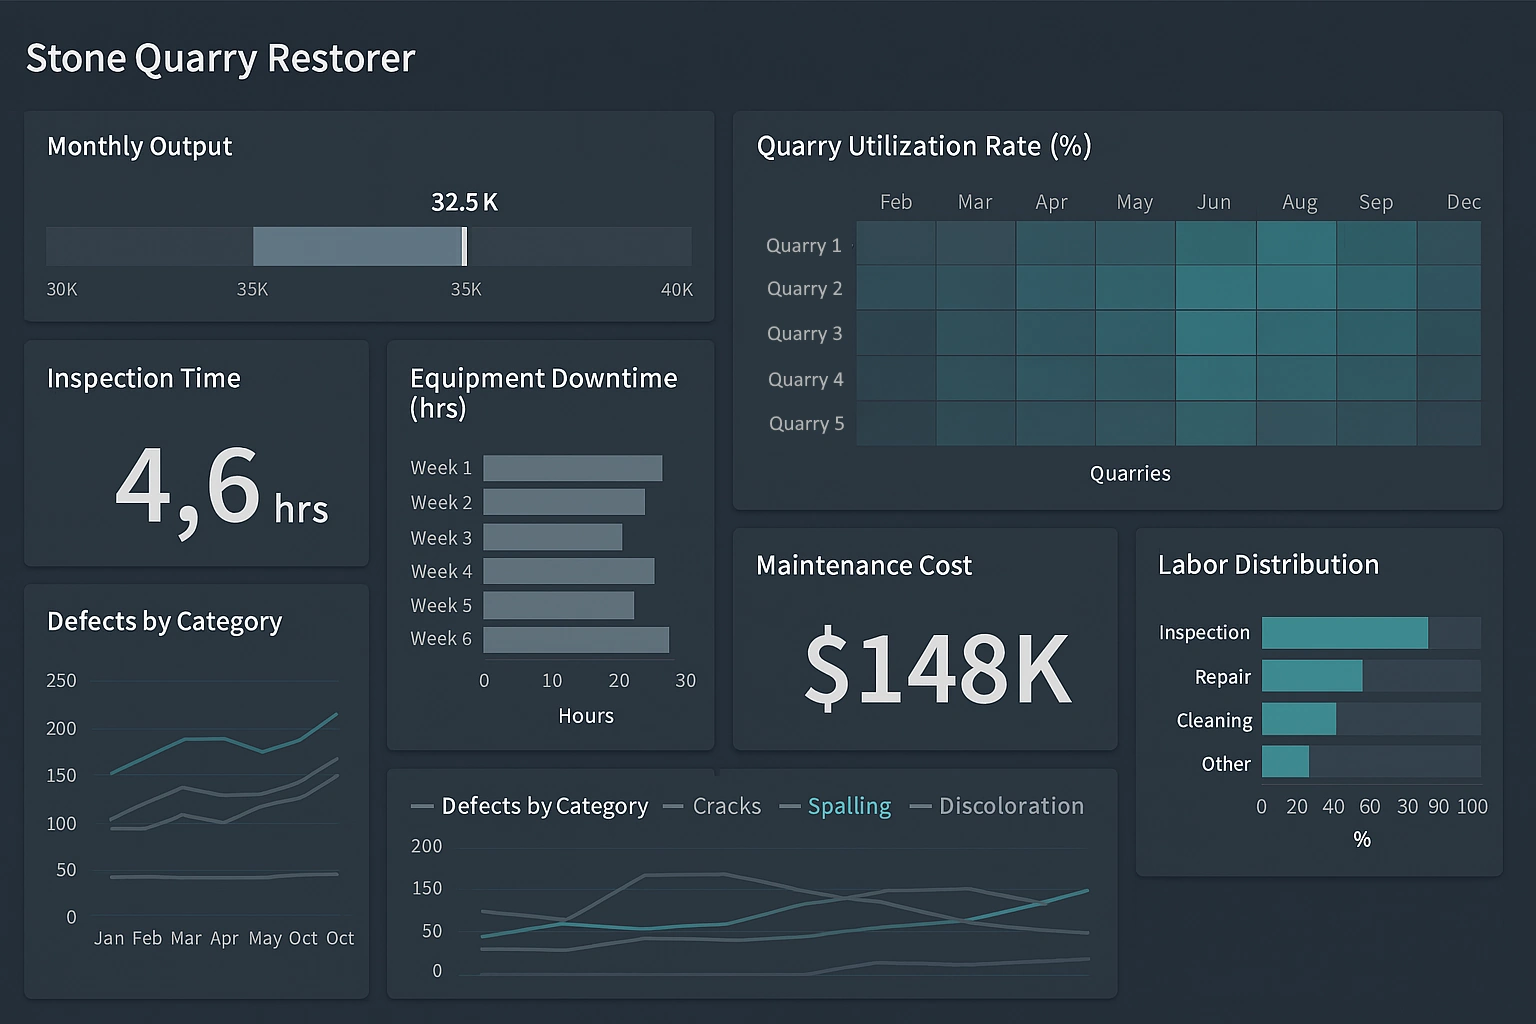
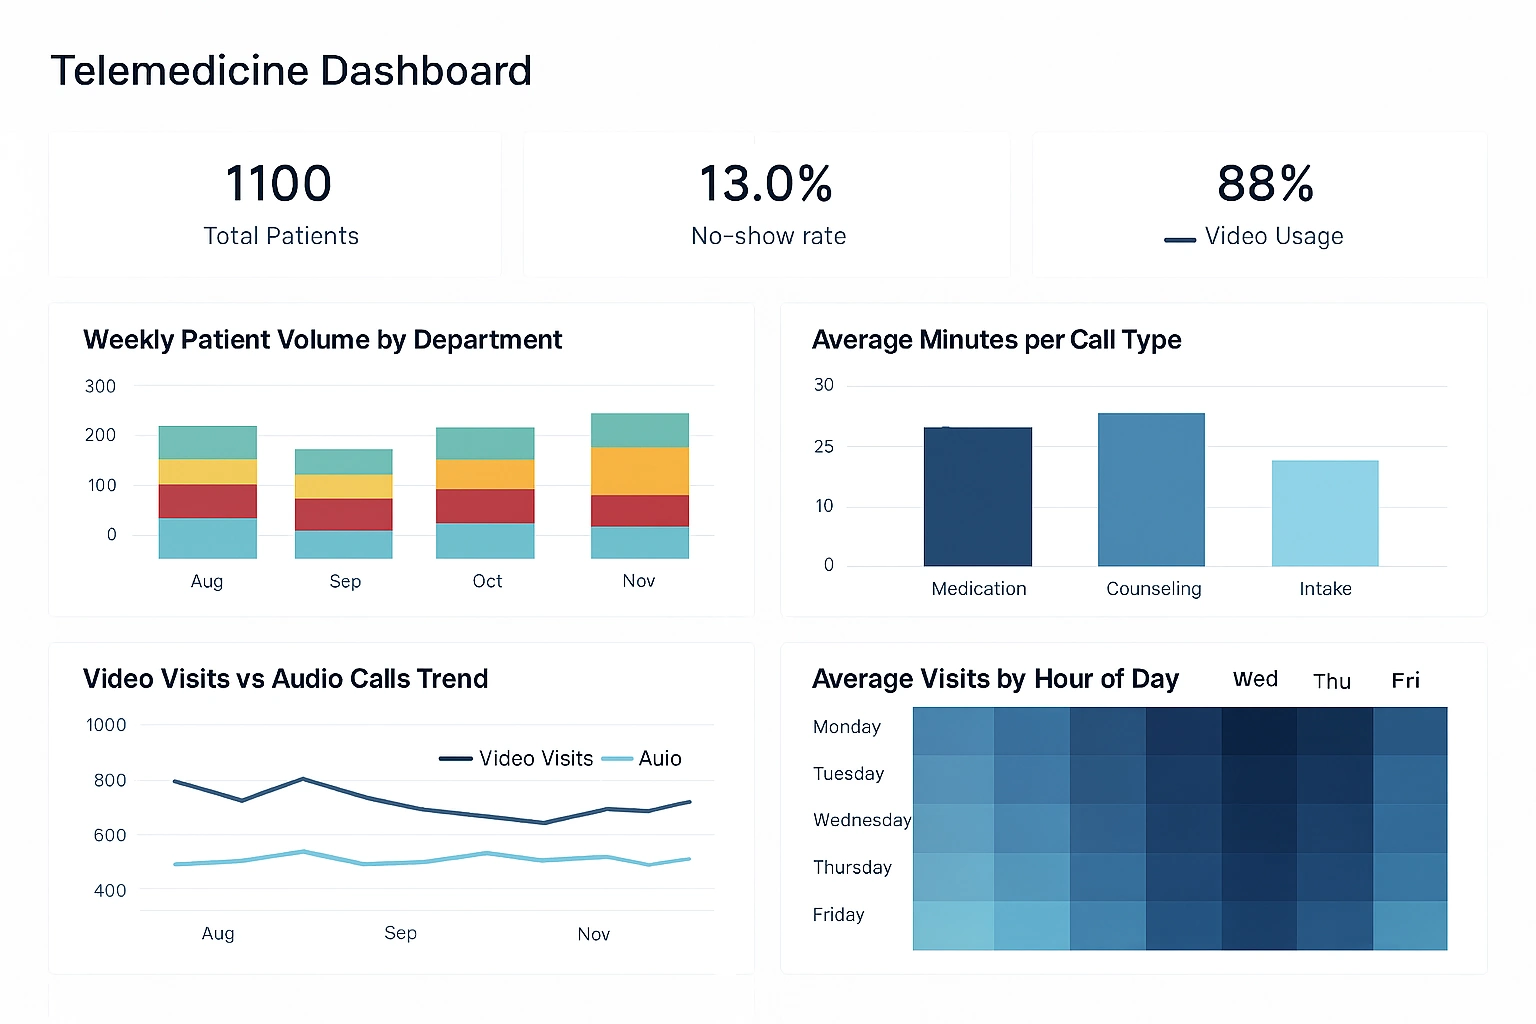
StyleBI supports highly interactive dashboards designed for exploration rather than static viewing. Filters, parameters, drill-downs, and linked views allow users to move from high-level KPIs to detailed data without leaving the dashboard.
Dashboards can be tailored for executives, managers, or operational teams. Layouts, interactivity, and refresh behavior can be adjusted depending on whether the dashboard is used for strategic review or real-time monitoring.
Advanced Visualization Options
Beyond basic charts, StyleBI includes a wide range of advanced visualization types. Heatmaps, treemaps, bullet charts, geographic maps, and custom visual components help convey complex patterns more effectively.
Visualization settings allow precise control over axes, labels, formatting, and thresholds. This enables teams to design dashboards that emphasize clarity and avoid misleading or overly decorative visuals.
Parameterized Reports
Parameterized reporting is another key function. Reports can accept user inputs such as date ranges, regions, or product categories. This makes a single report reusable for many scenarios instead of maintaining multiple static versions.
Parameters also support scheduled and automated delivery. For example, the same report definition can be sent to different recipients with customized filters applied for each audience.
Operational and Pixel-Perfect Reporting
StyleBI supports operational reporting where precision and layout control matter. Pixel-perfect reports are useful for invoices, regulatory documents, and standardized internal reports that must follow strict formatting rules.
These reports can pull from the same governed data models used by dashboards, ensuring consistency between analytical and operational outputs.
Real-Time and Scheduled Data Refresh
Data refresh behavior is configurable in StyleBI. Dashboards and reports can run against live queries, cached datasets, or scheduled refresh cycles. This flexibility supports both real-time monitoring and performance optimization.
For high-volume systems, caching and incremental refresh help reduce load on source databases while still keeping insights timely.
Security and Access Control
Security is built into StyleBI at multiple levels. Role-based access control determines who can view, edit, or distribute content. Data-level security ensures users only see rows or columns they are authorized to access.
These controls are essential for organizations handling sensitive financial, customer, or operational data. Security rules are applied consistently across dashboards, reports, and exports.
Embedding and Application Integration
StyleBI includes strong embedding capabilities. Dashboards and reports can be embedded directly into web applications, portals, or internal systems. This allows analytics to appear in the context where users already work.
Embedded analytics can inherit application authentication, apply dynamic parameters, and match the look and feel of the host application. This function is especially valuable for software vendors and internal platforms.
Collaboration and Sharing
Collaboration features allow users to share dashboards, annotate insights, and control visibility. Teams can distribute links, schedule email deliveries, or publish content to shared folders.
This function turns analytics into an ongoing conversation rather than a one-time deliverable. Insights can be reviewed, discussed, and refined collaboratively.
Exporting and Distribution
StyleBI supports exporting reports and dashboards to multiple formats, including PDF, Excel, and CSV. Automated distribution schedules can deliver these exports to stakeholders on a recurring basis.
This ensures that users who do not log into the platform still receive consistent and up-to-date information.
Scalability and Performance Management
The platform is designed to scale with growing data volumes and user counts. Query optimization, caching strategies, and load balancing help maintain performance as usage increases.
Administrators have visibility into query behavior and system load, making it easier to tune performance and plan capacity.
Customization and Extensibility
StyleBI allows customization through calculated fields, custom scripts, and extensible components. This makes it possible to address specialized business logic without building separate analytics tools.
Extensibility ensures that the platform can adapt as business requirements evolve rather than becoming a limiting factor over time.

Governance and Auditability
Governance functions include version control, usage tracking, and audit logs. Administrators can see who created, modified, or accessed reports and dashboards.
This visibility supports compliance requirements and helps maintain trust in analytics outputs across the organization.
Centralized Analytics Platform
At a higher level, one of the most important functions of StyleBI is consolidation. Instead of maintaining separate tools for dashboards, operational reports, data preparation, and embedded analytics, StyleBI brings these capabilities together.
This centralized approach reduces tool sprawl, lowers maintenance overhead, and makes analytics more consistent and accessible across teams.