Report Writing Software That is Powerful and Flexible, Yet Easy to Use
What Is Report Writing Software?
Report writing software is a business intelligence solution that enables organizations to create, format, generate, and distribute reports from one or more data sources. It transforms raw business data into structured reports that help users monitor performance, analyze trends, satisfy compliance requirements, and make informed decisions.
Unlike spreadsheets or manually prepared documents, report writing software automates data retrieval, calculations, formatting, and distribution. Reports can be generated on demand or scheduled to run automatically, ensuring stakeholders always have access to accurate, up-to-date information.
Modern report writing software supports relational databases, cloud applications, data warehouses, APIs, and other enterprise data sources. Many platforms also include interactive reports, dashboards, visualizations, role-based security, and AI-assisted analytics.


Benefits of Enterprise Report Writing Software
- Automates repetitive reporting tasks and reduces manual effort.
- Improves data accuracy by eliminating manual copy-and-paste processes.
- Provides consistent report formatting across departments.
- Connects to multiple business systems from a single reporting platform.
- Enables scheduled report generation and automated distribution.
- Supports regulatory compliance with standardized reporting.
- Improves collaboration by sharing reports through secure web portals or email.
- Provides role-based access to sensitive business information.
- Reduces IT workload through self-service report creation.
- Helps organizations make faster, data-driven decisions.
How Report Writing Software Works
Report writing software connects directly to databases, cloud applications, enterprise systems, and other data sources. Users select the data they need, define calculations and business rules, and design report layouts using tables, charts, summaries, and other visual elements.
Once a report has been created, it can be run on demand or scheduled to generate automatically. Many reporting platforms allow reports to be distributed through email, web portals, embedded applications, or exported to formats such as PDF, Excel, CSV, HTML, and Word.
Modern reporting solutions also support report parameters, allowing users to generate customized reports by selecting date ranges, regions, departments, customers, products, or other business dimensions without redesigning the report.
Security features ensure users only access reports and underlying data appropriate for their role within the organization.
Key Features of Report Writing Software
- Pixel-Perfect Report Design for professionally formatted reports.
- Multiple Data Source Connectivity including SQL databases, cloud applications, APIs, spreadsheets, and data warehouses.
- Parameterized Reports that allow users to customize output without modifying report definitions.
- Grouping and Subtotals for organizing detailed business information.
- Charts and Data Visualizations to summarize key metrics.
- Conditional Formatting to highlight exceptions and important trends.
- Scheduled Report Generation for daily, weekly, monthly, or event-driven reporting.
- Automated Distribution through email, portals, or embedded applications.
- Export Options including PDF, Excel, CSV, HTML, and Word.
- Interactive Web Reports with sorting, filtering, and drill-down capabilities.
- Role-Based Security to protect confidential business information.
- Embedded Reporting APIs for integrating reports into custom software applications.
- Cloud and On-Premises Deployment to fit diverse IT environments.
Common Types of Business Reports
- Operational Reports
- Financial Statements
- Sales Performance Reports
- Marketing Analytics Reports
- Inventory Reports
- Manufacturing Production Reports
- Executive Summary Reports
- Customer Service Reports
- Project Status Reports
- Human Resources Reports
- Compliance and Regulatory Reports
- Exception Reports
- Forecast and Budget Reports
- Healthcare Reporting
- Embedded Customer Reports
AI-Powered Reporting
Artificial intelligence is making enterprise reporting more intelligent by helping users discover insights faster and automate complex analysis.
- Natural Language Search allows users to search reports using everyday language.
- AI-Generated Summaries automatically explain important trends and business results.
- Anomaly Detection identifies unusual changes in KPIs that may require investigation.
- Forecasting predicts future performance using historical business data.
- Suggested Visualizations recommends charts based on the characteristics of the data.
- Automated Insights identifies significant changes, correlations, and emerging patterns.
These capabilities help organizations spend less time creating reports and more time acting on the information they contain.
Why Choose InetSoft for Report Writing Software?
InetSoft combines enterprise reporting, interactive dashboards, and self-service analytics in a single business intelligence platform. Organizations can build production reports, ad hoc reports, and interactive web reports while connecting to virtually any business data source.
- Pixel-perfect production reporting
- Interactive web-based reports
- Self-service report design
- Data mashup across multiple sources
- Powerful scheduling and automated report distribution
- Embedded reporting APIs for software applications
- Role-based security and data-level permissions
- Cloud, on-premises, Docker, and Kubernetes deployment options
- Unified reporting, dashboards, and visual analytics platform
- Scalable architecture for organizations of all sizes
Frequently Asked Questions About Report Writing Software
What is report writing software?
Report writing software is a business intelligence tool used to create, format, generate, and distribute reports from business data sources. It allows organizations to transform raw data into structured reports with tables, charts, calculations, summaries, and visualizations for analysis and decision making.
How does report writing software work?
Report writing software connects to databases, cloud applications, spreadsheets, APIs, and other data sources. Users select the required data, define calculations and filters, design the report layout, and generate reports on demand or according to a schedule. Reports can then be shared through email, web portals, embedded applications, or exported to common file formats.
What is the difference between report writing software and dashboard software?
Report writing software is typically designed for detailed, formatted, and structured reporting, such as financial statements, operational reports, and regulatory documents. Dashboard software focuses on interactive data exploration through visualizations, KPIs, filters, and real-time monitoring. Many modern business intelligence platforms combine both reporting and dashboard capabilities.
Can report writing software connect to SQL databases?
Yes. Enterprise report writing software commonly connects to SQL databases such as Microsoft SQL Server, Oracle, PostgreSQL, MySQL, and other relational database systems. Many platforms also support cloud databases, data warehouses, APIs, and business applications.
Can report writing software combine data from multiple sources?
Yes. Advanced reporting platforms can combine information from multiple data sources, allowing organizations to create reports that include data from databases, cloud applications, spreadsheets, CRM systems, ERP systems, and other business systems.

Can reports be generated automatically?
Yes. Report writing software can automate report generation through scheduling features. Organizations can create daily, weekly, monthly, or event-based reports and automatically distribute them to users through email, portals, or other delivery methods.
What types of reports can be created with report writing software?
Organizations use report writing software to create many types of reports, including financial reports, sales reports, inventory reports, manufacturing reports, customer service reports, compliance reports, executive summaries, operational reports, and embedded customer reports.
Can users create reports without programming?
Many modern report writing platforms provide visual report designers that allow business users to create reports without writing code. Users can select data fields, arrange report components, add calculations, apply formatting, and configure filters through a graphical interface.
What export formats are supported by report writing software?
Most enterprise reporting platforms support common output formats including PDF, Excel, CSV, HTML, Word, and other business document formats. This allows users to share reports with both technical and non-technical audiences.
Can report writing software create pixel-perfect reports?
Yes. Many enterprise reporting solutions support pixel-perfect report design, allowing organizations to precisely control layouts, fonts, spacing, page breaks, headers, footers, and branding for professional business documents.
Can report writing software be embedded into applications?
Yes. Embedded reporting capabilities allow organizations and software providers to integrate reports directly into web applications, customer portals, SaaS platforms, and enterprise systems using APIs and web-based reporting components.

How does report security work?
Enterprise report writing software uses security features such as user authentication, role-based permissions, and data-level security to ensure users only access the reports and information they are authorized to view.
What industries use report writing software?
Report writing software is used across industries including manufacturing, healthcare, finance, insurance, government, retail, education, logistics, telecommunications, and technology. Any organization that needs accurate, repeatable, and automated reporting can benefit from a reporting solution.
What is the difference between ad hoc reporting and scheduled reporting?
Ad hoc reporting allows users to create reports when they need answers to specific questions. Scheduled reporting automatically generates and distributes predefined reports at regular intervals or when specific conditions occur.
Can report writing software include AI capabilities?
Yes. Modern reporting platforms can incorporate AI capabilities such as natural language queries, automated summaries, anomaly detection, forecasting, and intelligent recommendations to help users discover insights faster.
Why use enterprise report writing software instead of spreadsheets?
Enterprise report writing software provides greater scalability, automation, security, data connectivity, and consistency than spreadsheet-based reporting. It reduces manual reporting effort while providing reliable access to business information across an organization.
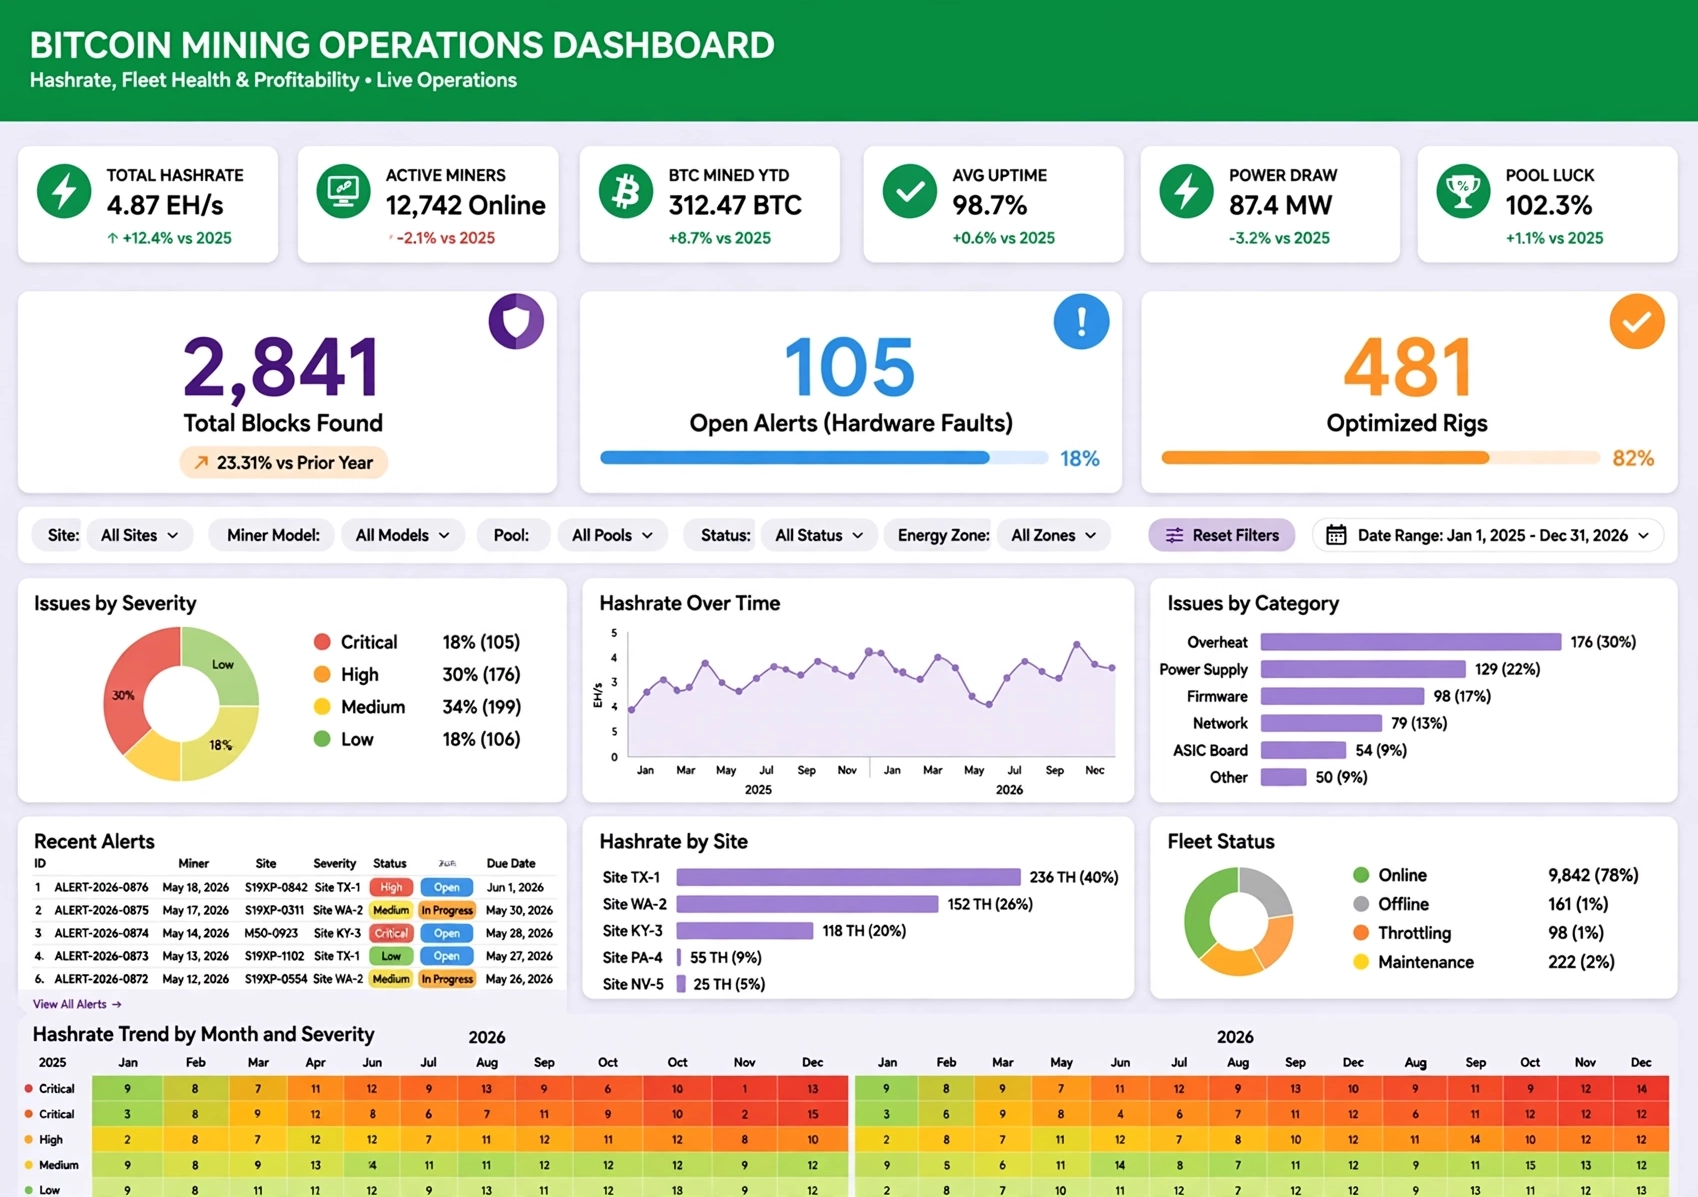
Case Study: Optimizing Bitcoin Mining Operations with Report Writing Software
CryptoMine Inc. is a mid-sized Bitcoin mining company headquartered in Texas, USA. With a mining facility housing over 10,000 ASIC miners, the company generates substantial computational power to mine Bitcoin. However, the management team faced challenges in monitoring performance metrics, energy consumption, and profitability due to the complex and dynamic nature of cryptocurrency mining.
Challenges Faced CryptoMine Inc. struggled with inefficient data management and reporting processes. The key issues included:
-
Manual Data Compilation: The team relied on spreadsheets to track mining efficiency, energy costs, and hardware performance, leading to errors and delays.
-
Lack of Real-Time Insights: Mining profitability depends on multiple factors such as Bitcoin price, network difficulty, and electricity rates. The absence of real-time analytics resulted in missed opportunities for optimization.
-
Regulatory Compliance: CryptoMine Inc. needed to ensure compliance with evolving regulations on energy consumption and financial reporting.
-
Scalability Issues: As the mining farm expanded, the volume of data became overwhelming, making it difficult to extract actionable insights.
Solution Implemented To address these challenges, CryptoMine Inc. adopted InetSoft's comprehensive report writing software with data integration and real-time analytics capabilities. The key features of the software included:
-
Automated Data Collection: The software integrated with mining pool APIs, energy meters, and financial systems to gather real-time data.
-
Custom Dashboards: Interactive dashboards provided an overview of mining efficiency, hardware performance, and profitability metrics.
-
Regulatory Reporting Tools: Built-in compliance reporting simplified the process of meeting regulatory requirements.
-
Scalability and Cloud Integration: The solution was cloud-based, allowing seamless scalability as CryptoMine Inc. expanded its operations.
Results Achieved The implementation of report writing software transformed CryptoMine Inc.'s operations:
-
30% Improvement in Efficiency: Automated reporting reduced time spent on data compilation and analysis.
-
Enhanced Decision-Making: Real-time insights allowed the team to optimize mining operations based on market conditions.
-
Better Compliance Management: Streamlined regulatory reporting ensured compliance with minimal manual intervention.
-
Cost Savings: Improved monitoring of energy consumption led to better cost control and increased profitability.
What KPIs and Metrics Do Bitcoin Mining Companies Use?
Bitcoin mining companies rely on several Key Performance Indicators (KPIs) and metrics to track performance, optimize operations, and ensure profitability. These KPIs cover mining efficiency, financial health, and operational sustainability. Here are some of the most important ones:
1. Mining Efficiency & Performance KPIs
- Hash Rate (TH/s, PH/s, EH/s) – The total computational power a miner contributes to the Bitcoin network. Higher hash rates increase the probability of mining new blocks.
- Block Rewards Earned – The number of Bitcoin blocks successfully mined, including transaction fees.
- Uptime (%) – Measures the operational efficiency of mining rigs. Higher uptime indicates fewer hardware failures and maintenance issues.
- Mining Difficulty – A dynamic measure of how hard it is to mine new blocks, adjusting roughly every two weeks based on network activity.
- Rejection Rate (%) – The percentage of mining shares rejected by the network, often caused by network latency or hardware inefficiencies.
2. Financial & Profitability Metrics
- Bitcoin Earned Per Day/Month – Tracks the amount of Bitcoin mined over a specific period.
- Revenue Per Megawatt (MW) of Power – Measures how much revenue is generated per MW of electricity used.
- Break-Even Hash Rate – The minimum hash rate required to cover operational costs without incurring losses.
- Profitability Index – The ratio of revenue to mining costs, indicating overall financial viability.
- Return on Investment (ROI) (%) – Evaluates how long it takes to recover capital investment in mining hardware.
- Network Transaction Fees Earned – Some miners earn additional revenue through transaction fees included in mined blocks.
3. Energy Consumption & Cost Metrics
- Energy Efficiency (Joules per TH or W/TH) – Measures power consumption per terahash, with lower values indicating better efficiency.
- Electricity Cost Per Bitcoin Mined ($/BTC) – Calculates the total electricity cost required to mine one Bitcoin.
- Power Usage Effectiveness (PUE) – Ratio of total energy used versus the energy consumed by mining hardware. A lower PUE indicates better energy efficiency.
- Carbon Footprint (CO₂ Emissions per BTC Mined) – Measures environmental impact and compliance with sustainability goals.
4. Hardware & Maintenance Metrics
- Hardware Failure Rate (%) – Tracks the percentage of mining rigs experiencing failures or needing replacements.
- Cooling System Efficiency (%) – Measures the effectiveness of cooling systems in maintaining optimal mining conditions.
- ASIC Lifespan & Depreciation Rate – Predicts how long mining equipment will remain viable before needing upgrades or replacement.
- Cost Per Miner Unit ($/Unit) – The upfront cost of each ASIC mining rig, impacting long-term profitability.
5. Market & Competitive Metrics
- Bitcoin Market Price ($/BTC) – Directly affects mining profitability, as revenue is tied to Bitcoin's price movements.
- Network Hash Rate Distribution – Identifies the miner's share of the global Bitcoin network and competitiveness.
- Mining Pool Distribution – Determines whether a company should join a mining pool for steadier payouts.
6. Compliance & Security Metrics
- Regulatory Compliance Score – Measures adherence to local and international mining regulations.
- Security Breaches & Downtime Events – Tracks instances of hacking, cyber threats, or technical failures.
- AML & KYC Compliance – Ensures mining revenues adhere to anti-money laundering (AML) and Know Your Customer (KYC) regulations.