InetSoft CEO Discusses the Evolution of Its Visualization Tools
A continuation of The Business Intelligence Network's exclusive interview with InetSoft’s Luke Liang
Ron Powell (Editorial Director of the Business Intelligence Network): So from an architecture perspective, your solution is based on all open standards? I believe it’s 100% Java. It’s a Web-based platform, and I think you have incorporated as well some proprietary, patent-pending technology and innovations? What are the unique business intelligence technologies that you have built to support the approach you are getting traction from?
Luke Liang (CEO, InetSoft Technology): Our BI platform is exactly as you described there. The open standards aspect is very important to us since it allows our customers to integrate our technology more easily and leverage assets they already have, in terms of hardware and software and IT skills.
So based on this BI platform, our software delivers a host of front-end BI tools including visualization tools, enterprise reporting, monitoring dashboards, and analysis. Those functions were based on a very powerful patent-pending technology we call Data Block.
This Data Block technology is really made up of a back-end data mashup engine and a caching middle layer. There is a front-end we call the worksheet, which is a Web-based, spreadsheet-like user interface that a power user can easily use to combine and transform data blocks.
| #1 Ranking: Read how InetSoft was rated #1 for user adoption in G2's user survey-based index | Read More |
The data blocks are typically started at the atomic data block level. That is typically created by an IT or a BI specialist. They choose these data blocks and performance tune those data blocks. Then the power users can use those building blocks to build more complex, but more useful structures for answering the questions they have on hand.
And all the data blocks you build, in turn become building blocks themselves. You can build on this architecture, building very sophisticated structures which you can use to answer a wide range of unanticipated questions.
The real-time access to the data is what this architecture delivers for you. It allows you to access different data sources regardless of whether it’s an operational data store or a data warehouse. It basically gives a means to the domain expert to shape the data on demand for whatever they need.
 |
Read how InetSoft saves money and resources with deployment flexibility. |
And so we are very excited about this BI technology that we have had for years. We have been showing this in the beta phase, and recently it has come into production mode. And we have already gotten very good feedback on the technology from customers.
Powell: You have recently had a new product innovation in the area of visualization tools. Could you go into some detail on that?
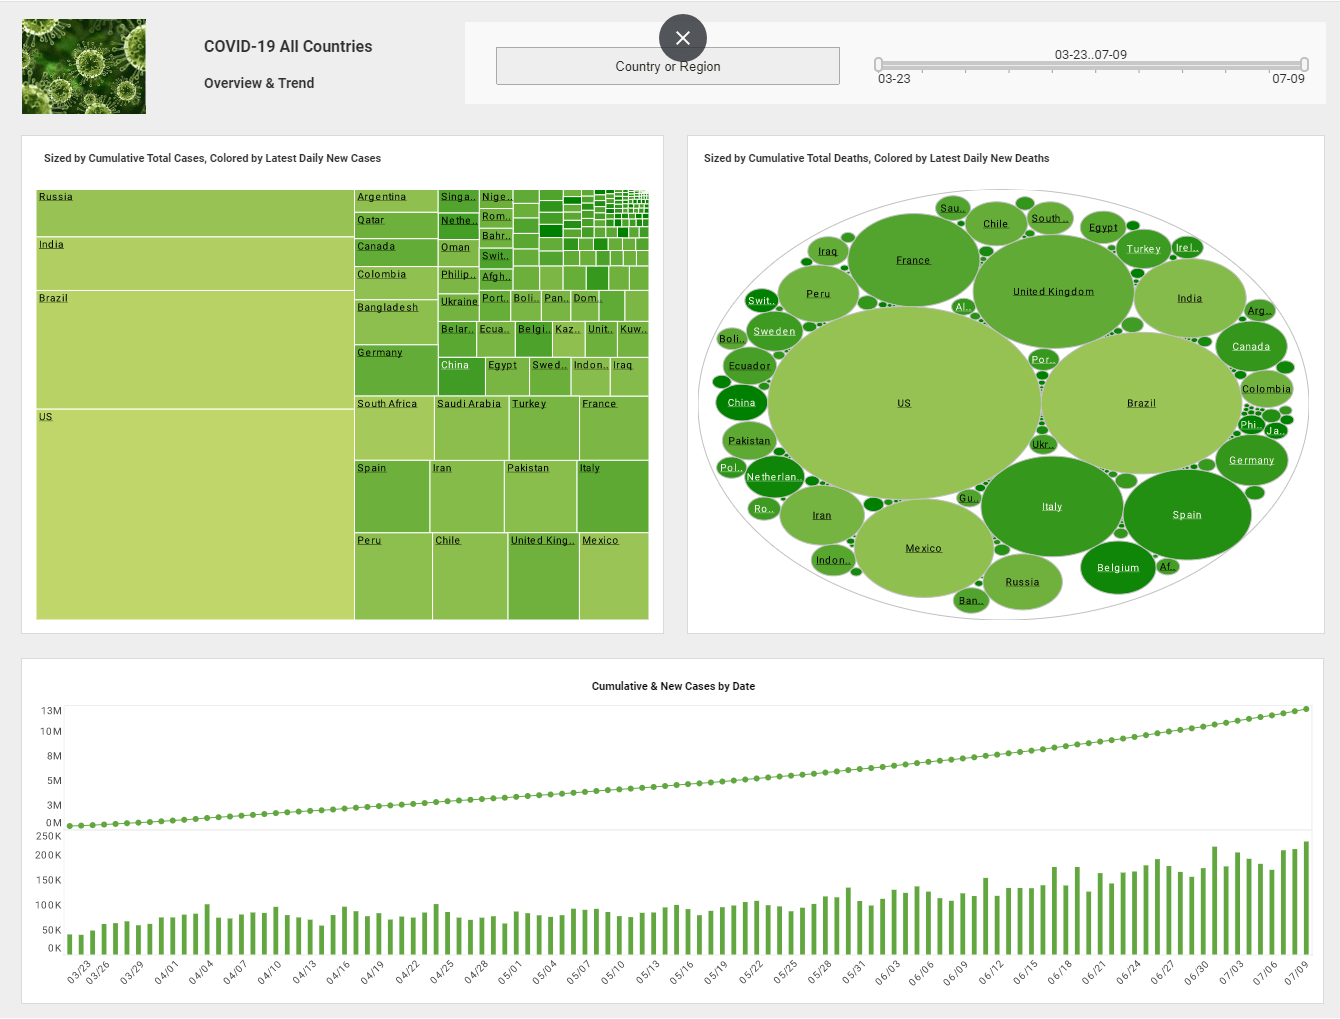
Liang: Yes. The most recent announcement we have made has to do with a visualization tool we call Style Scope. This is a visualization and exploration tool, and this functionality is also embedded in our Style Intelligence, which is our complete suite of business intelligence software.
So in simple terms to describe this visualization tool, it is basically a visual overlay on top of our data layer. We call our data layer worksheets. Then on top of that we produce something called viewsheets. With the viewsheet there are two modes of use. The first is for the end-users’ visualization. This doesn’t require any training. It’s what we call a click and select Web user interface.
 |
Learn about the top 10 features of embedded business intelligence. |
So in typical usage, in this mode, the users would have a dashboard interface. In a dashboard, they would have what we call output components which would show them the metrics they care about, in terms of their performance management. They could be speedometers and thermometers as well as time-series charts and graphs.
There are also input components. That’s where the business parameters, the variables, come in. That could be a date range or filter selection lists. You can change the inputs in a very intuitive manner because the user only needs to select and click on this input element to manipulate different dimensions. Then they can see the effect of how the measures, or metrics, would change. This lets them analyze these business metrics is a visual exploration mode.
Then the second mode we have is, of course, how to produce this analytical dashboard. It is again a pure Web-based HTML5-based user interface. You only have to drag and drop the elements in a spreadsheet like interface.
So this would really allow the end users to explore all their data in a very visual way on top of the data blocks they have already built. Once you have this analytic capability in place, you just as easily create monitoring dashboards. And a monitoring dashboard can also be used as an analytic dashboard. You can drill down into details as you wish. These interactive dashboards deliver a lot of benefits for the end users and really free them from depending too much on IT-heavy processes. It makes business intelligence a predominantly end-user driven process versus an IT process.
 |
Read the top 10 reasons for selecting InetSoft as your BI partner. |
| Previous: Business Analytics |


