Case Study: The World Health Organization (WHO)
Anti-tuberculosis (TB) drug resistance is a major public health problem that threatens progress made in TB care and control worldwide. Drug resistance arises due to improper use of antibiotics in chemotherapy of drug-susceptible TB patients. This improper use is a result of a number of actions including, administration of improper treatment regimens and failure to ensure that patients complete the whole course of treatment. Essentially, drug resistance arises in areas with weak TB control programmes. A patient who develops active disease with a drug-resistant TB strain can transmit this form of TB to other individuals.
Style Intelligence Features
Using Style Intelligence, WHO has created a way for website visitors to quickly view indicators of diagnosis and treatment of drug-resistant TB by country and year.
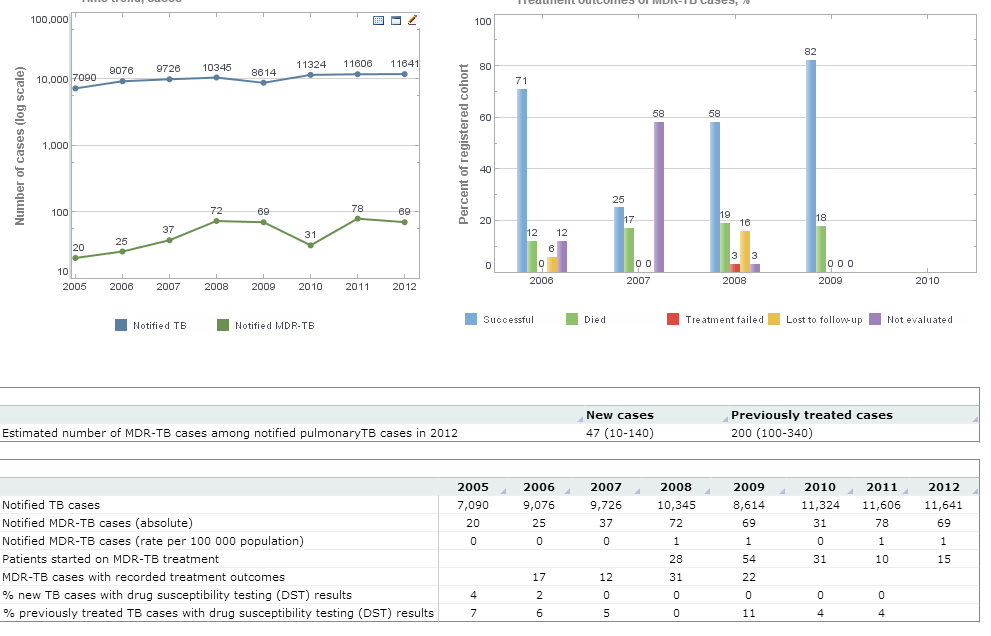
Various components of the Style Intelligence tool are used to create these visualizations. In the first example, line charts and bar charts are among the most obvious, using the "show values" plot property to display data at various points. Each line and bar is individually colored from a selection of over 16 million color choices in order to differentiate one "case" or "cohort" from the next. Below, a crosstab is used to display detailed information that cannot be quickly displayed in a graph.
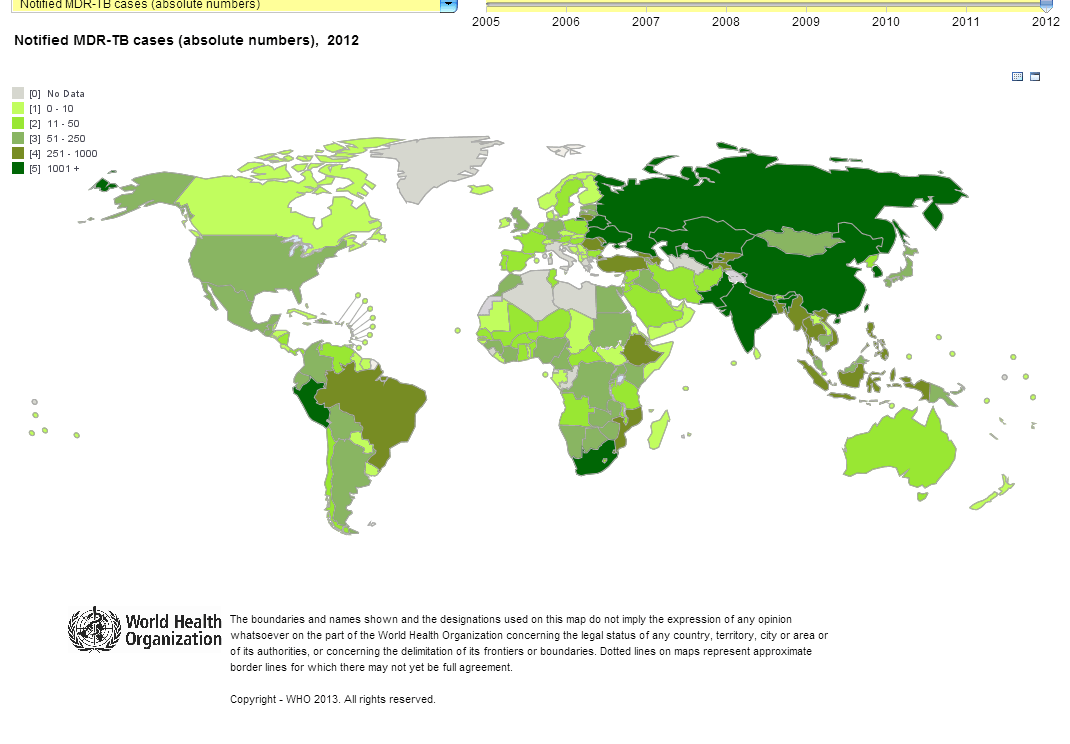
The second visualization uses Style Intelligence's embedded mapping system to create a visual representation of TB data that the user can sort and filter on a number of different levels. The drop-down menu, for example, gives users the option to display various diagnosis and notifications related to multi-drug resistant TB. The date slider allows users to further filter that data down to a relevant time frame.
Parameterized Reporting
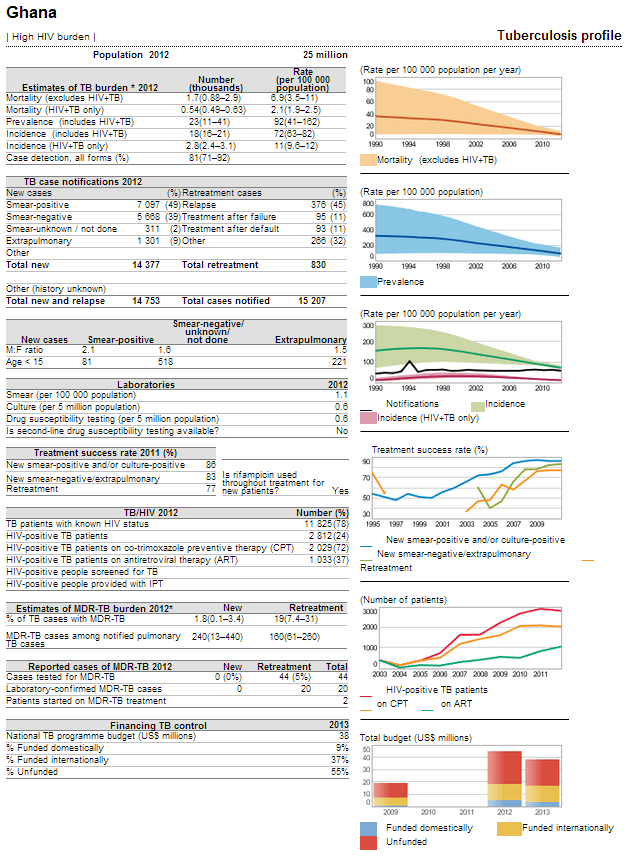
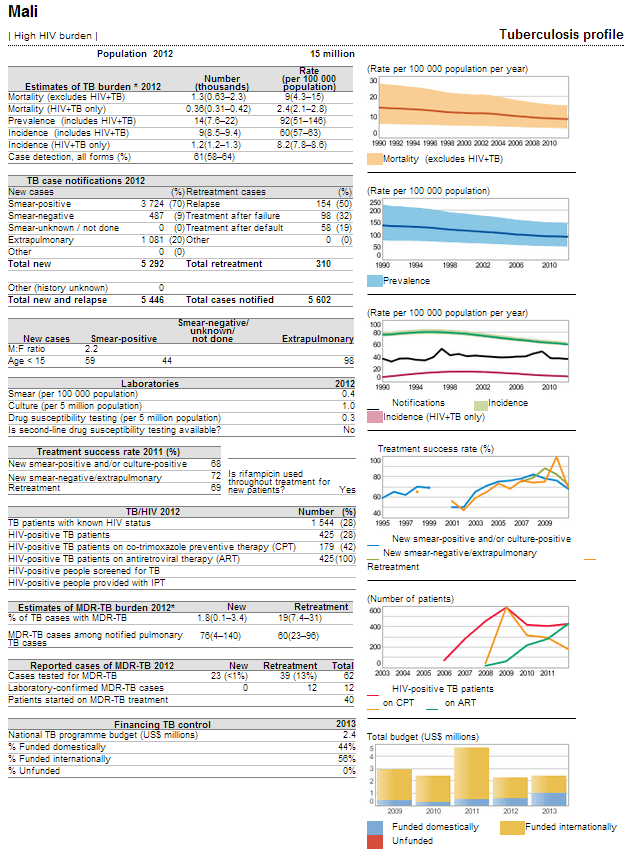
WHO has also used Style Intelligence to create a series of parameterized Web-based reports in the form of its Global Tuberculosis Report. Tuberculosis country profiles are generated automatically based on data reported by countries and which are held in WHO's global TB database. This information is updated on annual basis.
Users can choose what country's data they want to view by inputting a parameter, and the report will be run accordingly. Results can be viewed both on the Web or in .PDF format, as well as in English, Spanish, French, and Russian.
How NGOs and Nonprofits Can Use Business Intelligence
Business intelligence (BI) turns data into actionable insight, helping NGOs and nonprofits improve impact, optimize resources, and demonstrate accountability. When implemented thoughtfully, BI supports strategic decision making, improves program delivery, and strengthens donor relations by making outcomes measurable and transparent.
Why Business Intelligence Matters for NGOs
NGOs operate under resource constraints and high expectations from beneficiaries, funders, and regulators. BI provides a systematic approach to gather, clean, analyze, and visualize data so leaders can:
- Measure impact rather than activity, focusing on outcomes that matter to stakeholders.
- Allocate resources more efficiently by identifying cost drivers and program performance variations.
- Improve transparency through clear dashboards for board members and donors.
- Detect risks early by monitoring operational and financial indicators.
- Scale what works by rapidly identifying replicable program elements.
Core BI Components NGOs Should Implement
A basic BI stack for nonprofits includes data collection, a centralized data store, analytics tools, and reporting/dashboards. Each component should align with privacy and security practices appropriate to the data being processed.
- Data collection from program management systems, CRM, financial software, monitoring tools, and external sources.
- Data warehouse or data lake that consolidates structured and unstructured data for analysis.
- ETL processes to transform and validate data before analysis.
- Analytics and visualization tools for dashboards, cohort analysis, and predictive modeling.
- Governance including data stewardship, access controls, and documentation of metrics definitions.
Operational Benefits of Tracking KPIs
Programmatic Improvement
KPIs reveal which program elements are working and which are not, enabling continuous improvement cycles. When the data show a drop in service completion or learning gains, teams can test targeted fixes and measure the result.
Resource Optimization
Financial and operational KPIs such as cost per beneficiary, utilization rates, and inventory turnover help leaders reallocate funds, staff, and materials to higher-return activities.
Fundraising and Donor Reporting
Clear, outcome-focused KPIs make it easier to tell impact stories and justify funding requests. Dashboards that show progress against goals shorten fundraising cycles and increase donor confidence.
Risk Management and Compliance
Monitoring KPIs like budget variance, staff turnover, and compliance incidents allows organizations to detect problems early and remain audit-ready, protecting reputation and funding.
Strategic Planning and Scaling
Aggregated KPI trends inform long-term strategy by showing where demand is highest, which programs scale well, and where partnerships could amplify impact.
Practical Steps to Implement BI in NGOs
- Define your impact framework with clear outcomes, inputs, activities, and measurable indicators tied to your strategy.
- Start small with a few high-value KPIs and a simple dashboard before expanding to more complex analytics.
- Ensure data quality through standardized forms, periodic audits, and simple validation rules at the source.
- Automate data flows to reduce manual entry, speed reporting, and minimize errors.
- Invest in visualization so staff, boards, and donors can quickly absorb insights and take action.
- Build capacity by training staff on data literacy and assigning data stewardship roles.
- Protect sensitive data by applying role-based access, encryption, and clear retention policies.
Common Pitfalls and How to Avoid Them
- Chasing vanity metrics such as raw counts without linking them to outcomes; avoid by prioritizing outcome-focused KPIs.
- Overcomplicating dashboards with too many indicators; avoid by keeping dashboards goal-oriented and audience-specific.
- Neglecting training which leads to misinterpretation; avoid by embedding regular data use training into staff routines.
- Ignoring stakeholder needs which reduces adoption; avoid by co-designing dashboards with end users and funders.
Final Recommendations
BI is a multiplier for mission-driven organizations when it focuses on the right KPIs, maintains data quality, and embeds insights into decision cycles. Start with a clear theory of change, measure the indicators that map to outcomes, present results in simple dashboards, and continuously iterate. Doing so makes NGOs more effective, more accountable, and better positioned to scale their impact.