Best BI Data Mashup Software - InetSoft
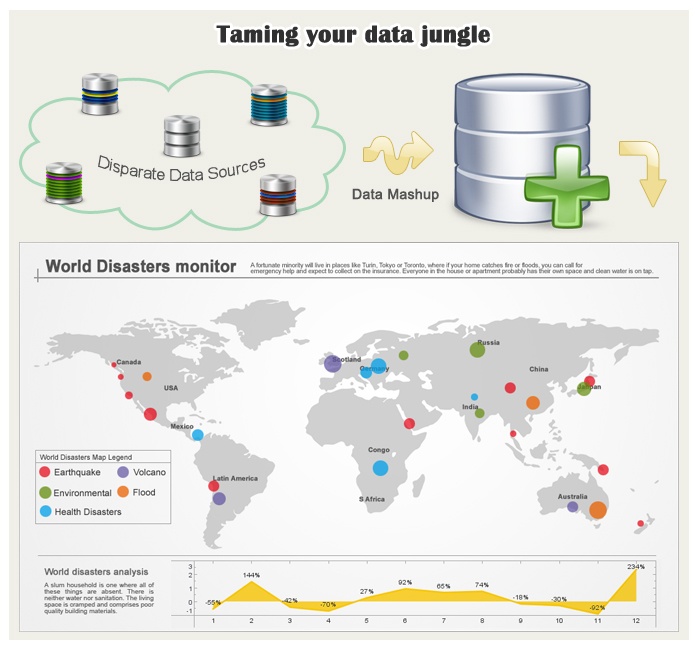
InetSoft provides a business intelligence platform for dashboard and reporting that includes powerful enterprise data mashup capabilities. With data mashup tools, disparate data sources of almost any type can be synthesized to produce reports and dashboards that provide new perceptivity and bring about internal information management efficiencies.
InetSoft is a pioneer in data mashup and offers a unique capability of end-user defined data mashup, which means even business users can combine fields from different data sources that were not previously modeled, and even import external data sources such as spreadsheets, to create a new dashboard or report to be shared in the BI environment. The end result is maximum self-service.
Data mashup also provides technical advantages such as building complex queries via a drag-and-drop query building tool. Furthermore, it enables the abstraction of 'agile business intelligence' whereby unused or unique data sources can quickly be added to a BI environment via direct communications to the operational data sources, forgoing the need for adding them to a data warehouse, or allowing experimentation before doing so.


Data Mashup Features
- mashups can be 'plugged in' to existing security infrastructure
- mashups can access data sources while adapting to native security mechanisms
- interactive dashboards and drillable reports can be rapidly constructed based on mashed up data
- connectivity to Relational databases (JDBC), Multidimensional databases, XML, SOAP, Java beans (POJO), EJB beans, flat files, and OLAP cubes
Data Mashup Applications
- cross-functional dashboards
- competitive analysis
- compliance and risk-assessment
- disaster monitoring and disaster response
- external vendor reports
- interdepartmental operations review
- situational awareness solutions
Data Mashup Benefits
- better ROI from SOA, legacy data sources and future mashups
- simpler sharing of information to all common user interfaces (portals, dashboards, spreadsheets, etc.)
- quicker access to internal and external data sources, regardless of format
- increased end-user adoption and satisfaction
- reduced internal reporting resource demands
- lower application development costs and risks
- less strain on IT resources
What Data Sources Does an Analyst at an EV Manufacturer Mash Up?
An analyst at an electric vehicle (EV) manufacturer may need to mash up data from a variety of sources to gain comprehensive insights into various aspects of the business. Here are some potential data sources an analyst might utilize:
-
Vehicle Telemetry Data: This includes data collected from the EVs themselves, such as battery performance, driving behavior, charging patterns, and vehicle diagnostics. Telemetry data can provide insights into vehicle efficiency, reliability, and potential areas for improvement.
-
Supply Chain Data: Analysts may gather data from suppliers regarding the sourcing of raw materials, component manufacturing, logistics, and inventory levels. Understanding the supply chain can help optimize procurement processes, identify bottlenecks, and ensure timely delivery of components.
-
Sales and Marketing Data: Data on sales transactions, customer demographics, marketing campaigns, and customer feedback can provide insights into customer preferences, market trends, and the effectiveness of marketing efforts. This data can help optimize sales and marketing strategies and identify opportunities for product differentiation.
-
Charging Infrastructure Data: For EV manufacturers, data related to charging infrastructure, such as the location and usage patterns of charging stations, can be valuable. Analyzing this data can help identify optimal locations for new charging stations, assess demand for charging services, and improve the overall charging experience for customers.
-
Regulatory and Policy Data: Analysts may need to track regulatory developments, incentives, and policy changes related to electric vehicles at local, national, and international levels. Understanding regulatory requirements and market trends can help inform product development, compliance efforts, and strategic planning.
-
Competitor Data: Monitoring competitors' activities, product offerings, pricing strategies, and market share can provide valuable insights into the competitive landscape. Analyzing competitor data can help identify strengths and weaknesses relative to competitors and inform competitive positioning strategies.
-
Energy Market Data: Since EVs are powered by electricity, analysts may need to consider energy market data, including electricity prices, renewable energy availability, and grid capacity. Understanding energy market dynamics can help optimize charging strategies, manage operating costs, and support sustainability initiatives.
-
Environmental Impact Data: EV manufacturers may track data related to the environmental impact of their products, such as carbon emissions reductions, energy efficiency improvements, and lifecycle assessments. Analyzing environmental impact data can help demonstrate the sustainability benefits of EVs and support corporate social responsibility initiatives.
More Resources for Data Mashup Users
Dealing with Environmental Pollution Effectively - Topics that are very much related to the industry are the consumption of raw materials and power. There are also issues related to environmental pollution that need to be looked at, which adds more load to the already complex decision-making process. This is another reason why it is essential to know what is happening and where it is happening...
Industrial Waste Generation Rate - The trash production rate is a crucial key performance indicator that measures the quantity of garbage generated in a certain period of time. It facilitates resource allocation and trash reduction initiatives by assisting companies in understanding the scope of their waste output. Businesses may spot patterns, anomalies, and inefficiencies in their waste generating operations by monitoring this KPI...
Power Supply Load Forecasting - To provide a steady power supply, accurate load forecasting is necessary. Load forecasting models, which estimate energy demand across different time periods, are often seen on power generating dashboards. In order to avoid disruptions during periods of high demand, power providers use these estimates to guide their choices about the scheduling of maintenance, the allocation of resources, and grid management...
Water Quality Metrics - A collection of KPIs for tracking water quality are the fundamental components of any dashboard in a water treatment facility. To make sure the water satisfies regulatory requirements, parameters including turbidity, pH levels, dissolved oxygen, and chemical concentrations are essential. Plant operators can quickly spot abnormalities and take remedial action to ensure water quality when these parameters are monitored in real-time...