Choosing the Best Data Visualization Tool for 2026
What do business decision makers look for when choosing the best data visualization tool for their company?
Factors to consider are the ability to mashup different types of data sources, the ability to import data, integration with data warehousing, options for prototyping new data, accessibility, and user-friendly features that speed up decision making.
InetSoft's StyleBI BI suite ranks a strong first in all these categories.


Database Connectivity
StyleBI users are empowered by the ability to import data from various databases, including JDBC, XML, Microsoft Excel, and many cloud sources such as Google and salesforce. See the full list. This ability becomes especially useful when tracking trends and patterns that may be overlooked in traditional reporting. The end result – be it data, dashboards, or reports – can then be displayed in a visually attractive manner and shared with other users.
Data Mashup
With data mashup, separate data sources of almost any type can be combined to produce reports and dashboards that provide new insights and create internal information management efficiencies.
InetSoft is a pioneer in data mashup and offers a unique capability of end-user defined data mashup, which means even business users can combine fields from different data sources that were not previously modeled, and import external data sources such as spreadsheets, to create a new dashboard or report to be shared in the BI environment. The end result is maximum self-service.

Ultimate Accessibility
StyleBI is unique in its ability to report across a multitude of data sources whether it is internal, external, or user generated. Users can select from a large variety of possible sources, without necessarily having to be aware of the underlying details.
Additionally, StyleBI is a completely Web-based, zero-client application. Users can connect to their data from any device with a web browser; this includes desktop computers as well as mobile devices such as iPads, mobile phones, Android tablets, etc.
Server administrators can set a large variety of parameters to control exactly what their users can and cannot see. By doing so, the same dashboard can be personalized on a user-by-user basis, displaying only data sources that are deemed appropriate or applicable to the current user.User Friendly Features
Eliminate desktop-based tools that were made with analysts in mind. StyleBI allows for any user to take advantage of the tool without having a background in advanced configuration or scripting. Once the infrastructure is in place, mash up and dashboard possibilities become endless and are no further than the click of a mouse. It has never been so easy for BI to become accessible to all company members no matter location or skill set.

The End Result
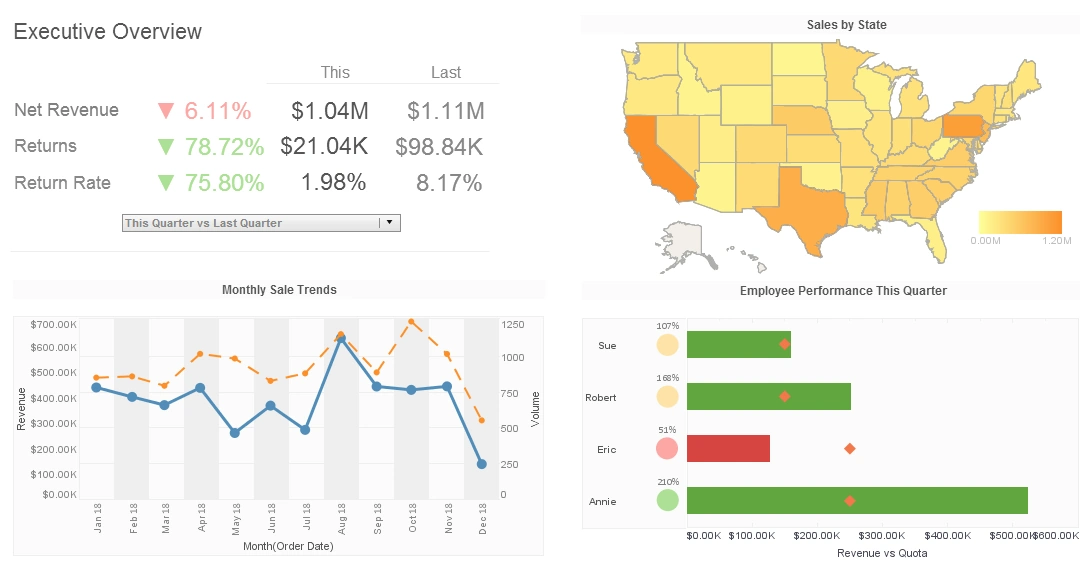
In short, a top data visualization tool, such as StyleBI, provides a newfound form of efficiency. It quickly provides a shared understanding of large quantities of data across a wide range of employees.
The benefit of clear and concise data only speeds up company productivity by engaging all employees and allowing more time for the company to focus on its consumer. Time is shifted from collection and interpretation to analysis. The tool thus becomes conducive to increasing company insight and understanding. It unifies the employees by creating a shared vision that is easily understood no matter the depth or complication.
Scaling New Heights: How a Rock Climbing Guide Agency Transformed with InetSoft's StyleBI
Nestled in the heart of Colorado's rugged Front Range, HighPoint Adventures was more than just a rock climbing guide agency—it was a community hub for thrill-seekers, weekend warriors, and aspiring mountaineers. Founded by two former pro climbers, Ava and Miles, HighPoint had grown steadily since its inception in 2012. What began as a passion project—just two guides and a handful of routes—evolved into a thriving business with over 30 staff members, three regional offices, hundreds of climbing packages, and a loyal customer base across the country.
But growth came with its own set of challenges.
By 2023, HighPoint was facing data chaos. Booking systems, route logs, guide schedules, customer feedback, incident reports, weather patterns, and marketing metrics were all siloed in different systems. The leadership team knew they were sitting on a goldmine of information, but it was scattered, inconsistent, and hard to act on. Reports were built manually—usually by cobbling together CSVs, spreadsheets, and rough visualizations in Google Data Studio.
Miles put it bluntly: "We were climbing in the dark."
That's when Ava stumbled upon InetSoft's StyleBI, an open-source, embeddable BI tool that promised data mashups, real-time dashboards, and a light footprint. It seemed too good to be true—but they decided to take a chance.
The First Ascent: Implementation
HighPoint's tech lead, a savvy ex-climber named Jordan, led the implementation. The open-source nature of StyleBI allowed for deep customization. Jordan appreciated that the tool wasn't a bloated enterprise platform but rather a flexible framework that could be tailored to their unique needs.
He began by connecting their primary data sources:
- The online booking system (via API),
- Their internal CRM (a self-hosted PostgreSQL instance),
- A third-party weather service,
- Google Sheets used by guides for field reports, and
- Social media campaign data exported from Meta and Google.
StyleBI's data mashup layer quickly proved to be a game-changer. Jordan created a unified data model that finally brought together disparate datasets: bookings linked to customer profiles, correlated with guide availability and weather patterns. The real-time transformation layer meant they could cleanse and harmonize inconsistent data without duplicating everything into a warehouse.
Route to Insight: New Dashboards
Within three weeks, Jordan had built the agency's first operational dashboard.
It showed bookings by region, broken down by guide, difficulty level, and weather forecasts. One insight jumped out immediately: a significant drop-off in intermediate bookings during monsoon season, even in areas where indoor climbing packages were available.
Ava and the marketing team pounced on the opportunity. They created a "Monsoon Pass" campaign promoting discounted indoor climbs and multi-session training packages. Within a month, revenue in the affected regions was up 14%.
But that was just the beginning.
Using StyleBI's embedded dashboards, they built a guide-facing portal. Now, guides could log in and see their schedules, route popularity trends, customer feedback, and safety incident stats—all in one place. It empowered them to proactively suggest safer or more popular routes and gave them a greater sense of ownership in the company's growth.
One guide, Luis, started tweaking his recommended routes after spotting patterns in customer reviews. His net promoter score shot up, and he quickly became one of the agency's top performers.
Harnessing the Summit: Strategy and Planning
With better operational visibility came sharper strategic planning.
The leadership team began using StyleBI for scenario analysis. They built visualizations to explore "what-if" cases—what would happen to bookings if they shifted guide coverage? How would demand shift if they offered beginner routes in higher-altitude areas?
One particularly eye-opening analysis showed that weekend bookings were saturating faster than expected, while weekday utilization lagged. The solution: a flexible pricing model that offered discounts for weekday climbs. They modeled multiple price tiers in StyleBI and simulated the impact on revenue and guide capacity before rolling out changes.
The result? A 21% uptick in weekday bookings with no drop in total revenue.
More impressively, Jordan used the Style Studio module to prototype a custom visual application that showed a geographic overlay of climbing incidents, overlaid with terrain data, weather history, and guide certifications. This not only improved risk management but also formed the basis of a new annual safety review process.
Customer Connection and Community Building
On the customer side, the transformation was equally profound.
HighPoint began to experiment with client-facing analytics. Through their portal, climbers could track their own stats—routes climbed, elevation gains, difficulty ratings, even personal bests over time. It turned out to be a hit. Casual climbers loved the gamification aspect, and hardcore enthusiasts appreciated the ability to monitor progress.
This personalized experience became a core part of HighPoint's brand.
They also began running satisfaction analysis. By tying feedback forms to booking data, they could isolate which route-guide combinations produced the best experiences. They started promoting those pairings more prominently. This helped new customers make better choices and drove repeat bookings up by 18% over six months.
The Cultural Shift
The real power of StyleBI wasn't just in the technology—it was in how it changed the culture at HighPoint.
Data became a daily conversation. Guides compared performance metrics not out of competition, but out of curiosity and shared pride. Managers used dashboards in weekly check-ins. Marketing teams used A/B test dashboards to optimize campaigns in near real-time. Finance had a clearer picture of cash flow, seasonality, and promotional ROI.
Ava described it as a "mindset shift from reactive to proactive."
And because the solution was open-source, Jordan and the tech team could continuously evolve it—adding new data sources, building custom components, and keeping it nimble without vendor lock-in.
Looking Forward: StyleBI as a Strategic Partner
Two years in, HighPoint's relationship with StyleBI has deepened. They've contributed plugins back to the community and even shared their story at an open-source summit. What began as a tool to clean up chaos turned into the foundation of a smarter, more resilient, more customer-centric business.
StyleBI helped them see the terrain ahead more clearly—and climb higher than they thought possible.
As Miles now puts it, "In climbing and business, knowing where to place your next hold makes all the difference. StyleBI gave us that map."