Evaluate InetSoft's Business Performance Dashboard Application
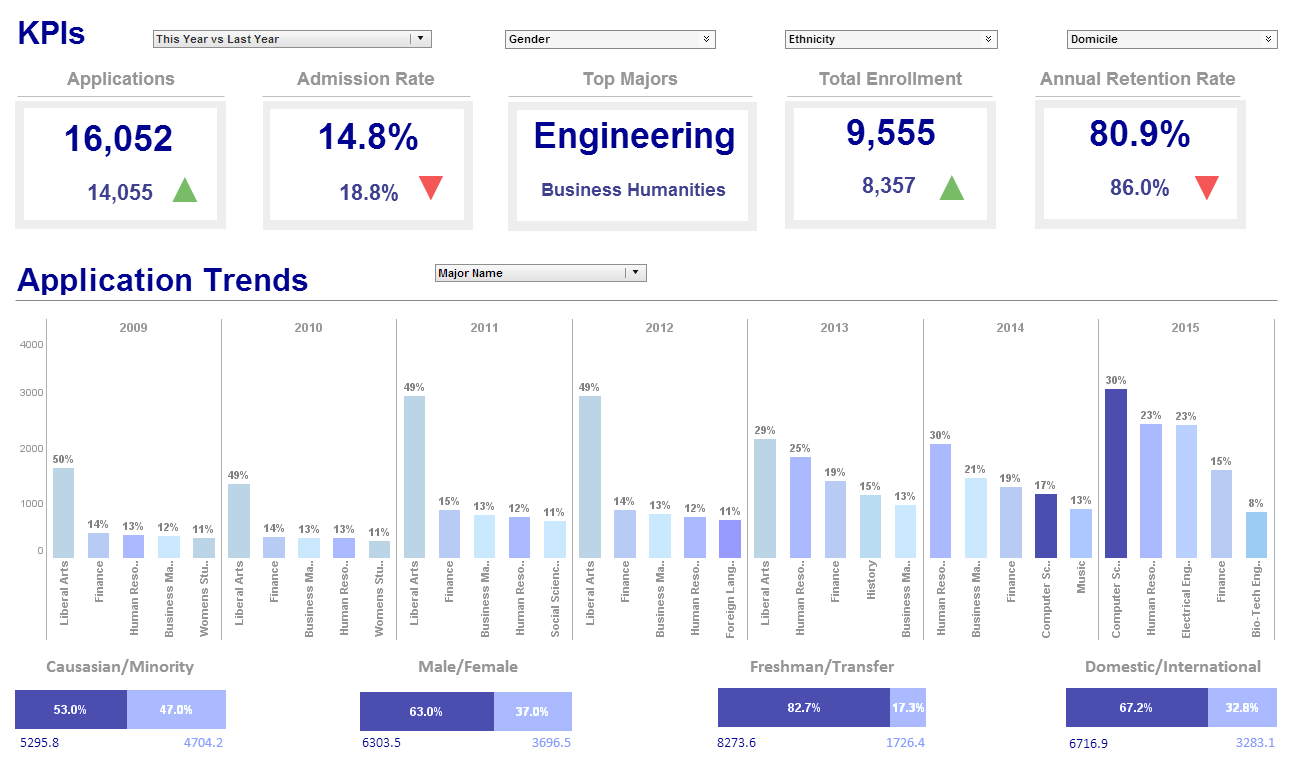
Are you looking for a business performance dashboard for tracking KPIs and managing performance? Since 1996 InetSoft has been making dashboard software that is easy to deploy and easy to use. Its unique data mashup capabilities enable unified views of corporate performance and maximum self-service.

Get An Example Related to Your Industry or Department:
About InetSoft
Since 1996 InetSoft has been delivering easy, agile, and robust business intelligence software that makes it possible for organizations and solution providers of all sizes to deploy or embed full-featured business intelligence solutions. Application highlights include visually-compelling and interactive dashboards that ensure greater end-user adoption plus pixel-perfect report generation, scheduling, and bursting. InetSoft's patent pending Data Block™ technology enables productive reuse of queries and a unique capability for end-user defined data mashup.
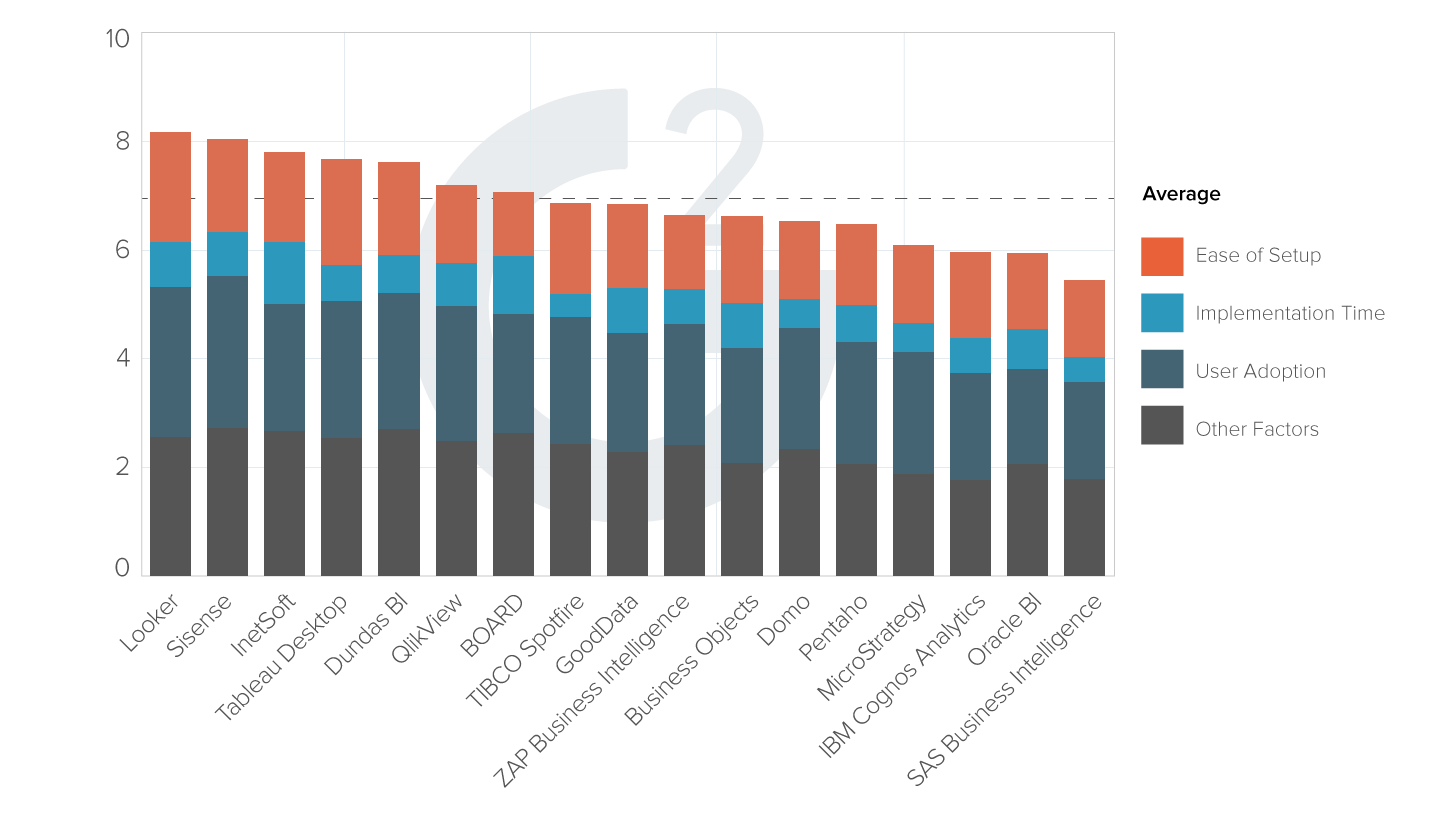
This capability combined with efficient information access enabled by InetSoft's visual analysis technologies allows maximum self-service that benefits the average business user, the IT administrator, and the developer. InetSoft was rated #1 in Butler Analytics Business Analytics Yearbook, and InetSoft's BI solutions have been deployed at over 5,000 organizations worldwide, including 25% of Fortune 500 companies, spanning all types of industries.

How EnviroTech Solutions Revolutionized Mercury Sorbent Manufacturing with InetSoft StyleBI Business Intelligence
EnviroTech Solutions, a leading manufacturer and distributor of mercury sorbent traps for environmental monitoring and industrial applications, transformed their operational efficiency and decision-making capabilities by implementing InetSoft's StyleBI business performance dashboard software. This case study examines how the company leveraged advanced analytics, real-time KPI monitoring, and interactive visualization tools to optimize their manufacturing processes, supply chain management, and customer service operations.
Company Background and Challenges
EnviroTech Solutions operates in the specialized environmental technology sector, producing mercury sorbent traps essential for air quality monitoring in power plants, industrial facilities, and environmental testing laboratories. The company manufactures over 50 different trap configurations, distributes to 200+ customers across North America, and processes approximately 15,000 orders annually.
Prior to implementing StyleBI, EnviroTech faced several critical operational challenges:
Data Fragmentation: Manufacturing data resided in their ERP system, quality control metrics were tracked in spreadsheets, inventory levels were managed through a separate WMS, and customer service metrics existed in their CRM platform. This fragmentation made it impossible to gain comprehensive operational insights or identify correlations between different business functions.
Reactive Decision Making: Without real-time visibility into key performance indicators, management decisions were based on historical reports that were often 2-3 weeks old. This delay particularly impacted production scheduling and inventory management, leading to stockouts of critical products and overproduction of slow-moving items.
Quality Control Blind Spots: Mercury sorbent traps require precise manufacturing tolerances and contamination-free environments. The company's quality metrics were tracked manually, making it difficult to identify trends or correlate quality issues with specific production batches, equipment, or environmental conditions.
StyleBI Implementation Strategy
EnviroTech's IT team, led by Director of Information Systems Michael Chen, selected InetSoft StyleBI after evaluating multiple business intelligence platforms. The implementation followed a phased approach over six months:
Phase 1: Data Integration and Warehouse Setup The team established connections between StyleBI and their primary data sources: Oracle ERP system, LabVantage LIMS for quality data, Manhattan Associates WMS for inventory, and Salesforce CRM for customer metrics. A staging area was created to cleanse and normalize data before loading into StyleBI's columnar database engine.
Phase 2: Core Manufacturing Dashboards Initial dashboards focused on production efficiency, quality control, and resource utilization. The team leveraged StyleBI's drag-and-drop interface to create real-time visualizations without requiring extensive coding knowledge.
Phase 3: Advanced Analytics and Predictive Modeling Integration of machine learning algorithms for demand forecasting and predictive maintenance, utilizing StyleBI's built-in analytics capabilities and R integration.
Key Performance Indicators and Metrics
Manufacturing Operations Dashboard
The primary manufacturing dashboard monitors 12 critical KPIs updated in real-time:
Overall Equipment Effectiveness (OEE): Composite metric combining availability, performance, and quality rates for each production line. Target: 85%
First Pass Yield: Percentage of mercury sorbent traps passing initial quality inspection. Target: 98.5%
Cycle Time Variance: Deviation from standard production cycle times, measured in minutes per batch. Target: <5% variance
Contamination Rate: Parts per million contamination levels detected during quality testing. Target: <0.1 ppm
Equipment Downtime: Unplanned downtime hours per production line per shift. Target: <2 hours per shift
Scrap Rate: Percentage of raw materials lost to defective production. Target: <1.5%
Supply Chain and Inventory Analytics
Inventory Turnover Rate: Calculated separately for raw materials, work-in-process, and finished goods. Target: 12x annually for finished goods
Supplier Performance Score: Composite metric based on on-time delivery, quality ratings, and compliance scores. Target: >95%
Demand Forecast Accuracy: Percentage accuracy of 30-day demand predictions. Target: >90%
Stockout Frequency: Number of stockout incidents per month across all SKUs. Target: <5 incidents
Customer Service and Sales Metrics
Order Fulfillment Rate: Percentage of orders shipped complete and on-time. Target: 98%
Customer Satisfaction Score: Based on post-delivery surveys. Target: >4.5/5.0
Average Order Processing Time: Hours from order receipt to shipment. Target: <24 hours
Return Rate: Percentage of products returned due to quality issues. Target: <0.5%
Dashboard Visualization and Chart Types
Production Efficiency Dashboard
The main production dashboard utilizes a combination of chart types optimized for different data visualization needs:
Real-time Line Charts: Display minute-by-minute production rates, temperature readings, and pressure measurements for each manufacturing line. These charts include dynamic threshold lines and color-coded zones to immediately highlight when parameters exceed acceptable ranges.
Heat Maps: Show production efficiency across different shifts, days, and production lines. Color intensity indicates performance levels, making it easy to identify patterns and outliers. The heat map revealed that third-shift production consistently underperformed, leading to targeted training interventions.
Gauge Charts: Display current OEE percentages with color-coded ranges (red: <75%, yellow: 75-85%, green: >85%). These provide immediate visual feedback on production line performance.
Waterfall Charts: Break down the components contributing to overall production costs, showing how raw materials, labor, overhead, and quality costs impact total manufacturing expenses.
Quality Control Analytics
Statistical Process Control (SPC) Charts: Monitor critical quality parameters using control charts with upper and lower control limits. These charts helped identify when mercury sorbent purity levels began trending toward specification limits, enabling proactive adjustments.
Pareto Analysis: Rank quality issues by frequency and impact, following the 80/20 principle to focus improvement efforts on the most significant problems.
Scatter Plot Correlations: Analyze relationships between environmental conditions (temperature, humidity) and quality outcomes, revealing that humidity levels above 45% significantly increased contamination rates.
Supply Chain Visibility
Inventory Level Trending: Multi-series line charts showing current inventory levels, reorder points, and safety stock levels for critical raw materials like activated carbon and specialized filter media.
Supplier Performance Scorecards: Combination of bullet charts and tabular data showing key supplier metrics, with red/yellow/green indicators for performance against targets.
Demand Forecasting Visualizations: Comparison charts overlaying actual demand against predicted demand, with confidence intervals and seasonal adjustment factors.
Advanced Analytics and Machine Learning Integration
Predictive Maintenance
StyleBI's integration with R enabled EnviroTech to implement predictive maintenance algorithms for their manufacturing equipment. The system analyzes vibration data, temperature readings, and usage patterns to predict when equipment maintenance is needed, reducing unplanned downtime by 35%.
Anomaly Detection: Machine learning algorithms identify unusual patterns in production data that might indicate equipment issues or process deviations. The system flags anomalies in real-time, allowing operators to investigate and correct issues before they impact product quality.
Failure Prediction Models: Statistical models predict the probability of equipment failure within different time horizons (24 hours, 7 days, 30 days), enabling proactive maintenance scheduling.
Demand Forecasting
The company implemented advanced forecasting models that consider multiple variables:
Seasonal Adjustments: Account for cyclical patterns in mercury testing requirements, particularly increased demand during environmental compliance reporting periods.
Economic Indicators: Incorporate industry-specific leading indicators such as power generation capacity additions and environmental regulation changes.
Customer Behavior Patterns: Analyze individual customer ordering patterns to predict future demand more accurately.
Results and Business Impact
Operational Efficiency Improvements
Manufacturing Productivity: Overall equipment effectiveness increased from 78% to 87% within six months of implementation. Real-time visibility into production bottlenecks enabled rapid response to issues.
Quality Enhancement: First pass yield improved from 94% to 98.2%, while contamination incidents decreased by 60%. The ability to correlate quality issues with specific production conditions led to targeted process improvements.
Inventory Optimization: Inventory turnover improved from 8.5x to 11.2x annually, while stockout incidents decreased by 45%. Better demand forecasting and supplier performance monitoring contributed to these improvements.
Decision-Making Transformation
Real-time Response: Management can now identify and respond to operational issues within minutes rather than weeks. This rapid response capability has been particularly valuable during quality incidents and supply chain disruptions.
Data-Driven Culture: The organization shifted from intuition-based decision making to data-driven analysis. Department heads now regularly reference dashboard metrics during daily operational meetings.
Cross-functional Collaboration: Shared dashboards improved communication between manufacturing, quality control, and customer service teams, leading to faster problem resolution and better customer outcomes.
Financial Performance
Cost Reduction: Manufacturing costs decreased by 12% due to improved efficiency and reduced waste. Energy costs were reduced by 8% through better equipment utilization scheduling.
Revenue Growth: Improved on-time delivery and product quality led to a 15% increase in customer retention and 20% growth in repeat orders.
ROI Achievement: The StyleBI implementation achieved positive ROI within 8 months, with ongoing annual benefits exceeding initial investment costs by 400%.
Technical Architecture and Integration
Data Pipeline Architecture
StyleBI's flexible architecture accommodated EnviroTech's diverse data sources through multiple integration methods:
Real-time Streaming: Production line sensors and quality control equipment stream data directly into StyleBI through MQTT protocols, providing sub-second latency for critical metrics.
Batch Processing: Nightly ETL processes extract, transform, and load data from ERP and CRM systems, ensuring consistent data quality and performance.
API Integrations: RESTful APIs connect StyleBI to cloud-based services and third-party applications, enabling real-time data synchronization.
Performance Optimization
Columnar Database Engine: StyleBI's columnar storage and in-memory processing capabilities enable sub-second query response times even with millions of data points.
Caching Strategies: Intelligent caching of frequently accessed data reduces database load and improves dashboard responsiveness.
Distributed Processing: For complex analytics operations, StyleBI distributes processing across multiple nodes, ensuring scalability as data volumes grow.


