Comparing Analytics Dashboard Tools: InetSoft, GoodData, Flourish, Cloudera, Secoda, Phocas
Analytics and business intelligence (BI) tools have become foundational in helping organizations make sense of the massive amounts of data they generate daily. While there are many tools on the market, this comparison focuses on six notable platforms: InetSoft, GoodData, Flourish, Cloudera, Secoda, and Phocas.
Each tool approaches analytics and dashboarding differently — some emphasize deep data modeling and governance, while others prioritize rapid visualization or self-service analytics. In this comparison, we’ll cover general capabilities, dashboard and visualization features, data modeling and management strengths, and where each platform fits best in a modern analytics stack.

1. Overview of Platforms
InetSoft is a BI and analytics platform rooted in traditional dashboarding and reporting. It’s known for its robust data mashup capabilities and flexible analytics design. GoodData is a cloud-native analytics platform that emphasizes embedded analytics and multi-tenant analytics environments. Flourish is a visualization-first tool designed for creating rich interactive visual stories and charts with minimal technical overhead. Cloudera is an enterprise data platform centered on big data management, supported by analytics tools through its broader ecosystem. Secoda is a data catalog and governance tool that helps teams understand and manage data assets before or alongside analytics. Finally, Phocas provides business analytics targeted at mid-market companies, blending dashboarding with intuitive data exploration.
2. Dashboarding and Visualization
All six platforms support dashboards, but they differ in purpose and strength. InetSoft provides customizable dashboards with drag-and-drop elements, allowing users to create operational and executive-level dashboards. It supports rich visualization libraries and real-time data updates, which make it suitable for operational reporting and embedded analytics. Its interface is feature-rich, though sometimes more complex than modern visualization-only tools.
GoodData offers a highly scalable dashboarding experience with an emphasis on multi-tenant deployment and embedded dashboards. Users can create interactive dashboards that refresh in real time, incorporate advanced filters, and support complex business logic. GoodData’s visualizations are strong in structured analytics use cases like KPI tracking and performance management.
Flourish stands apart as a visualization-first tool. Rather than functioning as a full BI suite, its primary strength is creating engaging, interactive infographics and narrative visuals. It excels in storytelling and media-rich visualizations that go beyond standard charts and tables, including maps, animated charts, and bespoke visuals easily embeddable in external websites.
While Cloudera itself is not a dashboarding tool per se, its ecosystem integrates with visualization frameworks such as Apache Superset, Tableau, and others. Cloudera’s core value lies in enabling analytics atop large data lakes and distributed processing systems. Thus, dashboarding typically happens through integrated BI tools — not native dashboards — focusing on large-scale data exploration.
Secoda, as a data catalog and governance platform, does not push traditional dashboards. Instead, it provides lineage graphs, metadata dashboards, and context-rich views of data assets. While it may display metrics, its visuals are about understanding data health, ownership, and usage rather than business KPIs.
Phocas focuses on ease of use, offering customizable dashboards tailored to business roles such as sales, finance, and operations. Its visualizations are straightforward and built for business users rather than data specialists. Users can drill down into charts and tables without needing technical skills, making it a good choice for companies prioritizing simplicity and rapid adoption.
3. Data Modeling Features
A crucial differentiator among these tools lies in how they approach data modeling — the way raw data is structured, transformed, and related before analysis. Strong data modeling enables consistent definitions, efficient queries, and governance.
InetSoft includes a semantic layer that lets users define business terms, calculations, and data relationships. Its data mashup engine allows joining data from disparate sources without necessarily building a separate data warehouse. Users can create logical models that abstract underlying complexity and provide reusable metrics and entities across dashboards. This is valuable for enterprises needing to standardize definitions and calculations across teams.
GoodData offers a robust data modeling environment centered around its “Logical Data Model (LDM).” GoodData’s LDM supports multiple fact and dimension tables, helping organizations build a governed structure for analytics. It allows users to define metrics once and reuse them across dashboards and reports. GoodData also supports versioning of models and multi-schema environments, which is useful in large-scale deployments with many analytical projects or clients. However, building complex models may require skilled analytics developers familiar with its modeling language.
Flourish differs significantly. It does not provide traditional data modeling features; instead, it focuses on preparing datasets for visualization. Users upload data or connect to data APIs, then use simple filters and transformations within the interface. Flourish assumes data is already prepped: it does not replace a data warehouse nor provide a semantic layer. This simplicity is beneficial for rapid prototyping or publishing visual narratives, but it requires that data modeling and governance occur upstream.
Cloudera’s strength in data modeling emerges from its broader data platform capabilities. Cloudera’s ecosystem (including tools like Apache Hive, Impala, and other compute engines) supports modeling large-scale datasets stored in distributed file systems or warehouses. Users can define table schemas, transformations, and data pipelines as part of an enterprise data architecture. This is less about drag-and-drop modeling inside Cloudera and more about supporting scalable data engineering and semantic layers that external analytics tools can consume. This architecture supports highly complex models at scale, ideal for organizations with significant data engineering resources.
Secoda approaches modeling from a metadata and governance perspective. It does not provide traditional modeling environments but offers a catalog of tables, columns, lineage, usage metrics, and dependencies. Secoda’s value lies in making existing data models discoverable and understandable. Users can explore relationships between datasets, track ownership, and surface quality issues. This strengthens governance and ensures that dashboards built in other tools rely on documented, trusted models.
Phocas combines basic modeling and data preparation within its platform. It supports loading and structuring data from spreadsheets, databases, and other sources, then defining simple calculated fields, hierarchies, and relationships. While not as sophisticated as GoodData or Cloudera for complex semantic models, Phocas enables business analysts to shape their data for analysis without deep technical skills. Its strength lies in ease of use rather than advanced modeling constructs.
4. Data Management and Governance
Data management features include data ingestion, transformation, access controls, lineage, and quality monitoring. These capabilities determine how reliably and securely organizations can produce analytics.
InetSoft provides connectors to a wide range of data sources and supports in-platform data preparation. Its governance capabilities include user roles, access controls, and centralized definitions. It can cache data for performance but relies on upstream systems for heavy data engineering. Security and governance are solid, though not as expansive as purpose-built governance tools.
GoodData has strong governance baked into its multi-tenant architecture. Administrators can manage user access at granular levels, define data schemas centrally, and enforce standards across analytical projects. Its cloud architecture provides automated scaling, backups, and performance tuning. However, governance still depends on proper modeling and disciplined administration to avoid fragmentation.
Flourish offers minimal governance features. It focuses on publishing visualizations and embeds permissions primarily around sharing and access to visuals. It does not manage data pipelines or lineage; these tasks must be handled outside the platform. For organizations where governance is critical, Flourish is best paired with a governed data source or warehouse.
Cloudera excels at data management at an enterprise scale. Its platform supports distributed storage, job scheduling, data quality frameworks, and cataloging when paired with additional modules. With role-based access control, encryption, and data lifecycle management, Cloudera is designed for organizations with strict governance and compliance requirements. It scales from terabytes to petabytes of data while maintaining governance standards.
Secoda focuses specifically on governance and metadata management. It provides data lineage, documentation, ownership tracking, and usage analytics. These features help teams trust their data and understand downstream impacts of changes. Secoda does not perform heavy transformations but surfaces metadata that ensures dashboards and models built elsewhere are based on reliable assets.
Phocas balances usability with governance. It provides user access controls, audit logs, and central metric definitions. While not as comprehensive as Cloudera or Secoda, this is sufficient for mid-market companies that need governance without complexity. Phocas also integrates with existing data sources while applying its management layer on top for consistency and security.
5. What Tool Fits Which Use Case?
Choosing the right analytics tool depends on specific organizational needs. InetSoft suits companies needing flexible dashboards and mash-ups, especially where data comes from many disparate systems. GoodData is ideal for cloud-native analytics environments where multi-tenant support, scalable modeling, and embedded dashboards are priorities. Flourish shines for marketing, editorial, or customer-facing visual storytelling where interactive visuals are the goal. Cloudera fits enterprises with massive datasets and strong data engineering teams requiring robust governance, distribution, and processing at scale. Secoda is best paired with other analytics tools to ensure data governance, lineage, and trust. Finally, Phocas is designed for mid-market businesses seeking rapid adoption, intuitive dashboards, and straightforward data exploration.
In summary, these tools span a spectrum from visualization-centric (Flourish) to enterprise data platforms (Cloudera), with others balancing BI dashboards and data transformation (InetSoft), embedded analytics and modeling (GoodData), or governance (Secoda). Understanding your organization’s priorities around data modeling, governance, scalability, and end-user experience will help guide the choice of platform.

More Articles About Analytic Dashboard Tools
Taking the Pragmatic Approach to Big Data Analytics - This webinar is inspired by a series of reports a research group put out. The most recent was called “Analytics: The Real-World Use of Big Data.” They published a study called Analytics: The New Path to Value. And in that study they took a high level look at the market and where organizations were placed along that maturity sophistication curve. They followed that up with a study called Analytics: The Widening Divide, and in that study they took a look at those sophistication levels and where organizations were focusing and took it a level down into the organizations themselves and how they were organizing themselves and executing an analytics within their organization. This year came Analytics: The Real-World Use of Big Data. So that’s a subset of the overall analytics market focused on the Big Data topic. Some of the questions, not all of them, but some of them, carry through from year to year. But they really try to touch on what’s most timely for executives in the business market place around the globe to focus on...
Talking About Big Data - And in that context, what we have seen more and more of our customers coming to us, talking about big data for example, where we have large volumes of data, or we have different types of data or coming in at different speeds. So I think some of our more mature customers are also focusing on what are the best practices around sampling when it comes to big data. When it comes to data visualization, what are some of best methods to use? When it comes to transformations, there are question such as how do we handle missing values? That’s from the data preparation process, and a lot of our customers are looking into some of the best practices on that end. Moderator: When you talk about sampling, I am presuming you are talking about taking a small subset of your data and creating some algorithms using the subset. Obviously if you are trying to develop an algorithm based on a megabyte of data, it's going to run a lot of faster than if you try to do that on a terabyte of data. When you do sampling, what’s a good percentage of the total? Is there a best practice there...
Team Analytics Platform for HR - Welcome everyone to today's webinar. I am Melissa Powell, and I'll be the moderator. Abhi and Michelle, would you like to introduce yourselves? Abhi: Sure. Hi, I'm Abhi Gupta, and I'm here with Michelle Ahn. And we work on the Intelligence and Insights Team here at InetSoft, under the Information Services Group specifically. Our team is responsible for building and deploying internal reports that provide business insights for the whole firm. And I specifically build websites for the firm to view these reports. One of the biggest projects we've been working on recently is transitioning the firm to a more modernized way of reporting. Michelle: Hi, my name is Michelle. I'm a developer on the Intelligence and Insights Team as well with Abhi. And as Abhi mentioned, we work with different internal teams. I specifically work with the HR team for their reporting meets. And like Abhi, I've been part of this big project where we were transitioning to a more modernized reporting system. Melissa: Alright, well, this is Melissa, again. I have a couple of questions about that. So Michelle, you mentioned you know, you do work with a number of internal teams and you have some stories to share with us today about something you've worked on with the HR organization. Could you tell us a bit about the analytics users in the HR organization at InetSoft...
Three Pillars of Data Analytics - Every business needs a strategy to function with gain maximum profit as well as sustain itself in the market. More than earning a profit, sustaining in the market is a big matter these days. Therefore, it is a must to use the latest data analytics techniques instead of just relying on the data available. Advanced data analytics comprises three pillars namely speed, agility, and performance which are important to utilize the full potential from it. These pillars strengthen the analytics strategies themselves and improve your business multiple folds. The three pillars of data analytics are: Speed Agility Performance. As we mentioned earlier, you cannot depend just on the available data and take a decision for your business. Rather you have to incorporate the latest data analytics techniques to get real-time data on the market situation and devise a strategy accordingly. This kind of data analytics cannot be done with a usual CPU. Because the machines performing the analytics has to take up a lot of input data and process them using several mathematical tools to achieve results...
Toolset for Business Analytics - Are you looking for a business analytics toolset for 2022? InetSoft's pioneering analytic application produces great-looking web-based visualizations with an easy-to-use drag-and-drop designer. Get cloud-flexibility for your deployment. Minimize costs with a small-footprint solution. Maximize self-service for all types of users. No dedicated BI developer required. View a demo and try interactive examples...

Top 16 Software Tools for Data Analysts 2022 - The growing market demand for data interpretation has led to the growth of high-level data analysis. This has provided opportunities for data professionals in the form of data analysis tools. Analysts and data experts now use tools and software to perform various analysis tasks. Analysts need tools that will guarantee high performance, while delivering the most accurate results in various tasks, including preparing data, generating predictions, executing algorithms, and automating reporting processes. The software should also have the capability to conduct standard tasks such as reporting on the findings and providing visuals which represent the results...
Top Trends for Business Analysts - I would like to welcome you to today’s webinar, titled “Top Trends for Business Analysts.” The webinar will last for approximately 60 minutes including the Q&A session. So, make sure that you submit your questions in advance using the question’s feature in the webinar software. I have got to admit it’s always fun to sort of pontificate what’s going on based on some of the experience that occurred to us over the year and reflect on them. I a sure a lot of questions will be spurred, and I will address a lot of these questions as we go on in the presentation, so stay tuned. Slides will be available afterwards as well. So, without further adieu I’d like to share with you our 10 key business analysis trends for 2012. Also, as we go on we are going to be putting up poll questions, so there will be plenty of opportunity for you to voice your opinion and have a say in the webinar. So I am looking forward to hearing your responses to some of the questions we’ve loaded in, in the form of polls. Also i will do my best to answer questions as we go on fly. They are an awful lot of you and one of me, so if your answers scrolls through and I miss it inadvertently, I do apologize in advance, I promise I will do my best to try and get to everybody’s questions...

Top Data Analysis Tools - In order to gain insights, your organization needs a BI solution that not only reports current performance, but can also run analysis to predict future outcomes.The greatest return on your investment will be from a software that has both powerful and intuitive data analysis tools...
Top Ways Analytics Are Used In the Insurance Industry - The insurance industry is highly competitive, with many different companies competing for the same customers. In the past, evaluating risks was a lengthy process. Insurance companies collect customer information relating to claims, policies, and actuarial so that the underwriters could consider the risks involved in insuring clients. This process was not always accurate and did not allow the business to scale. The industry has seen rapid changes over the years as it has become digital and continues to make technological advancements. Most insurance companies now use data analytics to extract essential and meaningful information from big data. Using analytics allows them to better understand their consumers and lower their own business risks...
href="/business/solutions/the_three_dimensions_of_analytics/">Three Dimensions of Analytics - Some people think about analytics as simply predictive type capabilities; others as advanced math, statistics; others as speed of thought visualization; and still others, maybe a little old school of thinking a bit, as multi-dimensional analysis, OLAP and things like that. So I don’t really have a great definition to give but I can tell you this: I have looked into analytics for quite some time now. And I will say that it has three dimensions...Upgrading from BambooHR to StyleBI for Analytics - BambooHR does an excellent job at what it was designed to do: simplify core HR operations for small and mid-sized organizations. Its dashboards are clean, approachable, and tightly integrated with employee records, time-off tracking, and basic reporting. For many teams, especially early on, that is more than enough. Problems start to appear when HR data stops being purely operational and begins to play a strategic role across finance, leadership, and other business functions. As organizations grow, expectations around HR analytics change. Leadership wants trend analysis, not just snapshots. Finance wants workforce data blended with compensation, budgeting, and forecasting. Managers want self-service views tailored to their teams. At that point, BambooHR’s dashboards begin to show their limits. They are helpful, but constrained, opinionated, and ultimately designed to live inside the BambooHR product rather than operate as part of a broader analytics ecosystem...
Use Case of Maximizing Drug Launches with Analytics - The second use case that we're going to explore is really focused around drug launches and being able to maximize what that launch experience looks like. The key question that we're going to go ahead and shine a light on is how a pharmaceutical company might really be able to understand some of the early adoption related to their drug in the effort of being able to maximize their sales and being able to maximize their marketing launch as well. As many of you know, being able to understand the early adoption of a drug that you just launched to market is extremely important and critical to being able to understand the long term success of that particular launch. Now, there are a couple of different ways that you can actually think about how a drug is being adopted. But it's really important to understand the settings in which that drug is actually being used and prescribed. That might be understanding which hospitals have started to use your drug. That might be understanding which physicians have started to prescribe your drug. It's really kind of a starting point to understand the success of a launch...
Using Analytics to Increase Staffing Productivity and Improve Hospital Operations - Today we will highlight the many ways that our customers are using data to disrupt industries and business processes in the healthcare industry, specifically in the hospital management sector. Presenting for us today is the Director of Data Management at Centre Hospitalier Universitaire de Québec. At the hospital one of the research projects includes staffing workloads and productivity, operational metrics such as throughput, capacity management and regulatory compliance and more. Currently they are using AI and advanced analytics to predict outcomes related to sepsis, denial of paper resources, staffing and employee turnover. We have a team called Data Management and Performance Measurement. Let's call them DM and PM. Today we would like to share with you a little bit about of our hospital and our team. The hospital's mission is to take exceptional care of people. In doing that we have gone through a journey of transformation of knowledge, of position and growth, in which it depend on the right strategies and technologies. My team was created five years ago. The vision is to simplify technology for a dynamic success. In this five year journey, we will share with you how we did this in the five years. So today, this is our fifth year in this journey. When we started out in our journey in the first year, because the needs are tremendous, we realized that we needed to maximize and develop availability of the information right away. In doing that, I would share with you in the next few slides...

Value of eCommerce Analytics - It is a shame that so many ecommerce websites are still not making adequate use of data analytics. It is like leaving money on the table. There Is Data Everywhere -- Use It If you were a physical retailer, you would have to work hard to collect enough meaningful data to get your management information systems (MIS) to turn out actionable recommendations. But in the case of online retail, data logs are updated every time your customer interacts with your website. Fancy Marketing Strategies Can Wait, First Focus on What the Customer's Actions Are Telling You I'm sure you want to tap into visual marketing, content marketing, seasonal marketing, and other advanced eCommerce marketing strategies. But before you do that, why not simply evaluate the way customers interact with your website, and use that to guide your actions. Of course, it is possible to get overwhelmed by analytics. So let us look at the basic analytics data that you need to focus on...
Visual Analytics Company - Are you looking for a good visual analytics company? Since 1996 InetSoft has been making business software that is easy to deploy and easy to use. Build self-service oriented dashboards and visual analyses quickly. View a 3-minute demo and download a free version...
Visual Analysis Examples - With its roots going back to 1996, InetSoft's visual analysis software StyleBI uses a reporting-driven approach to enable rapid deployment of analytical dashboards. Dashboard software has been established as a highly effective business intelligence tool. More than just monitoring-oriented or reporting-oriented, these tools support advanced visual analysis. StyleBI is not a desktop tool. While it can be run on the desktop for individual use, it is Web based server solution that enable visual the visualization engine below. Click on the images to get a better look...
Visual Analytics Evaluation - Visual analysis is a relatively new innovation in information management software that allows a person to explore data in an interactive, visual manner. At its simplest, it means charting and graphing data, but the novelty is in multi-dimensional charting and interactivity. Multi-dimensional charting allows you to add coloring and implement sizing options. Coloring means coloring different data points on a two-dimensional chart to denote more information. For example start with a graph of sales opportunities where closing probability is depicted on the y-axis and days until expected close date on the y-axis, with dots represented a single opportunity. You would already be able to identify imminently winnable opportunities in the upper left corner. Now color the dots by sales person, a different color for each person. Now a scan of the color patterns shows who has more open opportunities and where they are in the likelihood and timeliness to close. Add another dimension by sizing those dots by dollar amount, such that the larger the revenue potential of the opportunity, the larger the circle is. Now, at a glance you can prioritize opportunities to focus on...
Visual Analytics Reviews - When it comes to business intelligence, a visually interactive data analysis capability is essential for proper forecasting and planning. As a well known name in the BI industry, InetSoft has been consistent in delivering one of the most agile and intuitive data analysis tools, provides aesthetically pleasing representations of data....

Visual Analytics Software - Are you looking for a method to explore data in a simpler, more effective way than traditional static reports? Visual analytics software provides critical insight into solving problems and answering questions in data using interactive graphics...
Website Engagement Metrics Online Businesses Need to Track and Analyze - Every online business that strives for visibility and conversion must understand and analyze website engagement metrics. These numbers provide insights into the effectiveness of marketing strategies and reveal user behavior and preferences. This article explains two crucial aspects of digital analytics: measuring the success of affiliate marketing efforts and tracking overall online engagement. Each domain has its set of Key Performance Indicators (KPIs), which can significantly contribute to a business's growth and success when monitored and analyzed correctly. You'll often encounter various engagement metrics when exploring business growth case studies. These metrics are essential in evaluating how users interact with a website or platform, providing insights into user behavior, content effectiveness, and overall engagement. They demonstrate the extent to which users are involved with your content and can be crucial indicators of the potential for business growth...
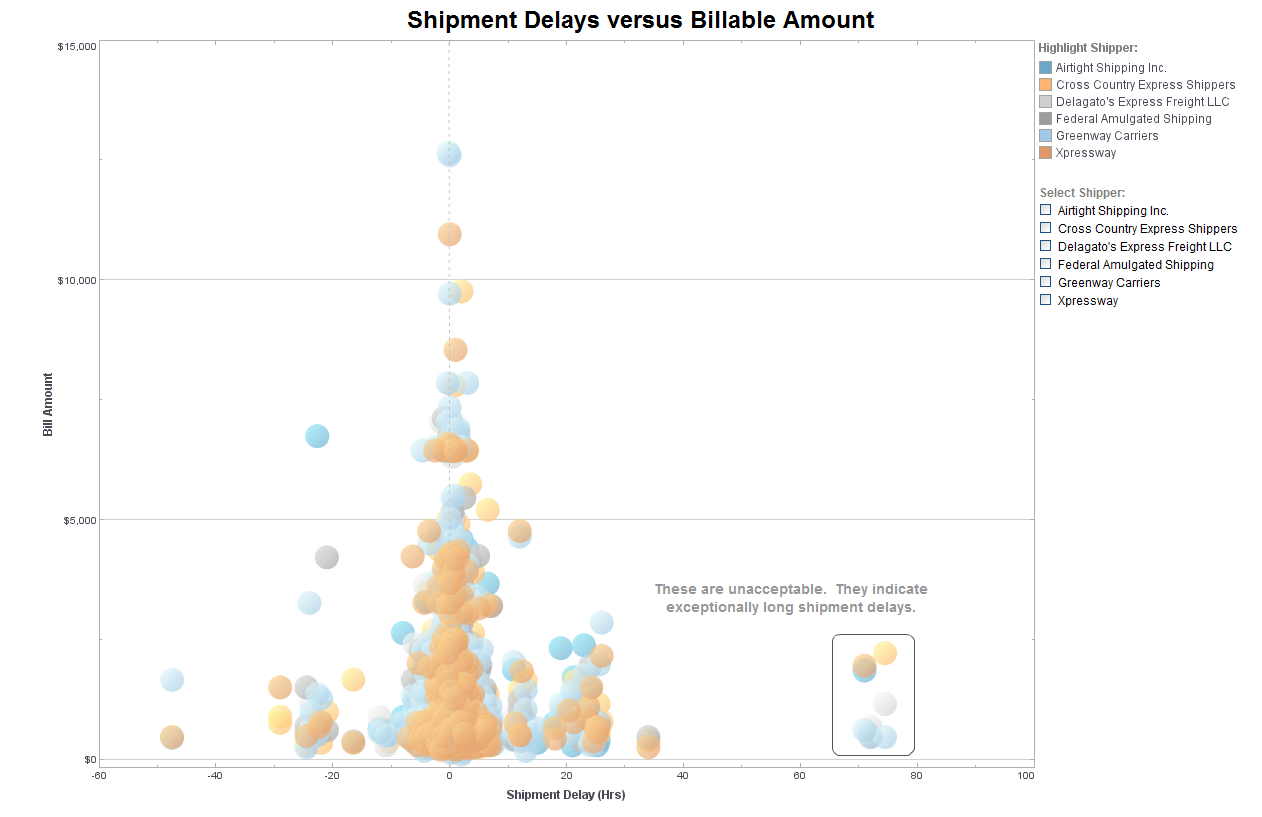
What Analytics Does a Data Scientist at a Transportation Logistics Company Do? - A Data Scientist at a transportation logistics company plays a crucial role in leveraging data to drive business decisions and optimize operations. Here are some of the key analytics tasks that a Data Scientist in this domain might be involved in: Route Optimization: Data Scientists analyze historical transportation data to identify optimal routes for shipments. This involves considering factors like distance, traffic patterns, delivery time windows, and cost constraints. Demand Forecasting: They develop models to predict future demand for transportation services based on historical data, seasonal trends, market conditions, and other relevant factors. This helps in capacity planning and resource allocation. Supply Chain Efficiency: Data Scientists work on optimizing the supply chain by analyzing data related to inventory levels, lead times, production schedules, and demand forecasts. They may use techniques like demand-supply matching and safety stock optimization. Cost Analysis: They conduct cost-benefit analyses to evaluate the efficiency and profitability of different transportation options, including modes (e.g., road, rail, sea, air) and carriers. This helps in making informed decisions about carrier selection and cost-effective transportation strategies...
What Analytics Does a Major Agricultural Enterprise Do? - These analytics span across different domains and can include: Yield and Crop Analytics: Analysis of historical yield data to identify trends, patterns, and factors affecting crop productivity. Predictive analytics to forecast crop yields based on factors such as weather conditions, soil quality, and agricultural practices. Crop monitoring using satellite imagery, drones, and IoT sensors to track crop health, growth, and development in real-time. Optimization of planting strategies, irrigation schedules, fertilization practices, and pest management techniques to maximize yields while minimizing input costs and environmental impact. Supply Chain and Logistics Analytics: Optimization of supply chain networks to ensure efficient transportation, storage, and distribution of agricultural products. Analysis of demand patterns, market trends, and customer preferences to forecast demand and optimize inventory levels. Route optimization and scheduling algorithms to minimize transportation costs, reduce delivery times, and improve customer service...
What Are the 5V's of Data Analytics? - The process of reviewing and analysing data in order to extract insights and make educated decisions is referred to as data analytics. It entails collecting, processing, and analysing data from multiple sources, including as databases, spreadsheets, and internet platforms, using a variety of methodologies and tools. The 5V's of Data analytics are: Velocity Volume Variety Value Veracity. Volume refers to the amount of data present in the database. The value of the data is determined by its size. When you have an enormous amount, it is considered big data. It is also relative to the computing power available. But generally, Data analytics is founded upon the presence of a large volume of data without which it is impossible to create advanced models for machine learning or AI. The tech world is progressing toward AI which requires processing, learning, and understanding huge volumes of data. Companies trying to beat their competitors must have such data to develop and use advanced analytics. The speed with which data is being accumulated and accessed refers to the Velocity. In this tech era, you can find huge amounts of data flowing in and out every day. This continuous flow of data must be quick so that it is available for businesses to use to their advantage at the right time. The market situation is highly competitive which demands creating timely strategies. This can only be possible with the help of big data...
What Are All the Cost Items to Include in a Total Cost of Ownership Analysis for a BI Solution? - Software Costs: License Fees: Upfront costs associated with purchasing BI software licenses. Subscription Fees: Ongoing subscription costs for cloud-based BI solutions. Hardware Costs: Servers and Storage: The cost of physical or virtual servers and storage infrastructure required to host the BI solution. Networking Equipment: Costs for routers, switches, and other networking hardware. Implementation and Deployment Costs: Consulting Services: Fees for external consultants or implementation partners. Training: Costs for training internal staff on using and managing the BI solution. Customization and Integration: Custom Development: Costs associated with developing custom features or reports. Integration Costs: Expenses related to integrating the BI solution with other systems...
What Are All the Types of Production Analysts? - There are different types of production analysts, depending on the nature of the production process and the specific industry. Here are some examples: Manufacturing Production Analysts: They are responsible for monitoring and analyzing production processes in manufacturing facilities. They collect data on productivity, quality, efficiency, and safety, and use statistical methods to identify opportunities for improvement. Supply Chain Production Analysts: They focus on the supply chain and logistics aspects of production. They track inventory levels, analyze demand patterns, and optimize production schedules to ensure timely delivery of goods. Operations Production Analysts: They work in a variety of industries and are responsible for analyzing production operations. They may monitor plant performance, equipment utilization, and workforce efficiency to improve productivity and reduce costs...
What Are the Different Types of Data Analysis? - Descriptive Analysis Descriptive analysis is the process of using statistical techniques to describe or summarize a set of data. It is popular for its ability to generate accessible insights from otherwise uninterpreted data with simple discrete numerical answers. They are frequency, mean, median, mode, percentiles, and quartiles. 2. Diagnostic Analysis Diagnostic analysis is a form of advanced analytics that examines data or content to answer the question "why." It is performed by using human-driven techniques such as drill-down, data discovery,and data mining. It also includes making calculations using statistical software or functions for such things as correlations and trend lines. 3. Exploratory Analysis Exploratory analysis is the critical process of performing initial investigations into data to discover patterns, groupings, correlations, spot anomalies, identify outliers, develop hypotheses and test assumptions. It is entirely a human-driven visual approach...
What Are the Operations of OLAP? - OLAP (Online Analytical Processing) is a multidimensional analysis and reporting technology that enables businesses to quickly analyze and explore their data. OLAP operations can be classified into two categories: Slice and Dice and Roll-up and Drill-down. Slice and Dice: "Slice and Dice" operations allow users to analyze data from different perspectives. They involve selecting a subset of data from a multidimensional dataset based on one or more criteria. The two types of "Slice and Dice" operations are: Slice: This operation involves selecting a single dimension from the OLAP cube to slice the data along that dimension. For example, a user can slice the data by selecting only the data for a particular region or time period. Dice: This operation involves selecting multiple dimensions from the OLAP cube to slice the data along those dimensions. For example, a user can dice the data by selecting only the data for a particular region and time period...
title="What Are the Types of Market Research That Benefit from Dashboard Analytics?">What Are the Types of Market Research That Benefit from Dashboard Analytics? - Descriptive Research: Purpose: This type aims to describe the characteristics of a population or phenomenon. It provides a snapshot of the current situation. Example: Surveys or questionnaires to understand customer demographics. Exploratory Research: Purpose: This is used when the problem or issue is not well understood. It helps in identifying potential solutions or avenues for further investigation. Example: In-depth interviews, focus groups, or case studies. Causal Research: Purpose: Causal research aims to establish a cause-and-effect relationship between variables. It helps in understanding how changes in one variable affect another. Example: A controlled experiment to determine how changes in pricing affect sales. Quantitative Research: Purpose: This involves the collection and analysis of numerical data. It focuses on measurable variables and statistical analysis. Example: Surveys with closed-ended questions, data analytics, and statistical modeling...What-If Analysis - InetSoft's what-if analysis feature assists analysts in quantifying uncertainty in causal relationships and optimizing resource allocation while guiding decisions. InetSoft's StyleBI is the comprehensive real-time analytical reporting and dashboard software solution used at thousands of enterprises worldwide. View the example below to learn more about the StyleBI solution...
What Is an Analytical Operations Dashboard? - An analytical operations dashboard is a powerful tool used by organizations to monitor, analyze, and visualize key performance indicators (KPIs) and operational metrics in real-time or near-real-time. It serves as a central hub where data from various sources and systems are collected, transformed, and presented in a visually intuitive format, enabling stakeholders to make informed decisions and gain actionable insights into the overall health and performance of their operations. In essence, an analytical operations dashboard goes beyond simple data visualization. It leverages advanced analytics and data processing techniques to provide a comprehensive view of an organization's operational activities. This includes tracking metrics related to production, sales, supply chain, customer service, financial performance, and more. By aggregating and presenting this data in a clear and concise manner, decision-makers can quickly identify trends, anomalies, and areas for improvement, ultimately leading to better strategic planning and operational efficiency...
What Is Apache Iceberg and Why Is InetSoft's Analytic Application a Good Fit for It? - Businesses in the data management and analytics space are always looking for creative ways to improve efficiency and extract useful information. The integration of Apache Iceberg with InetSoft's Analytic Application is one such combination that has garnered popularity. A sophisticated data intelligence software with a cutting-edge table structure improves corporate intelligence and analytics. We will examine the features and benefits of Apache Iceberg and its ideal fit for InetSoft's Analytic Application in this article. Conventional table formats for structured data management, such Apache Hive and Apache HBase, have shown to be effective. However, these formats are beginning to show their limits as data volume and complexity have increased. The requirement for a new table structure that could solve these issues and provide more flexibility and efficiency gave rise to Apache
What Is Augmented Analytics? - Augmented analytics is a kind of data analytics that automates and improves the analytical process by using machine learning and artificial intelligence (AI) technologies. Data scientists must manually compile, analyze, and interpret data in conventional analytics, which may be a laborious and difficult procedure. But firms may automate data preparation and analysis using augmented analytics, giving business users access to insights and the ability to make wise choices in real-time. In this post, we'll examine what augmented analytics are, why they're important, and how they may help businesses in a variety of sectors. Defining Augmented Analytics Augmented analytics is a sophisticated kind of data analytics that automates and improves the analytical process using machine learning and AI techniques...
What Is the Difference Between a Sales Operations Analyst and an Operations Analyst? - A sales operations analyst and an operations analyst are two distinct roles that serve different functions within an organization. A sales operations analyst is primarily responsible for analyzing and optimizing the sales operations of a company. They use data and analytics to identify trends, patterns, and areas for improvement in the sales process. They monitor key performance indicators (KPIs) such as revenue, pipeline, win rates, and customer acquisition costs to improve the effectiveness and efficiency of the sales team. On the other hand, an operations analyst is responsible for analyzing and optimizing the operations of a company as a whole. They focus on improving the efficiency and effectiveness of various business processes across departments. They analyze data to identify bottlenecks, inefficiencies, and areas for improvement, and make recommendations for process optimization, cost reduction, and productivity improvements...
What Is an Example of Biostatistical Analysis? - An example of biostatistical analysis is the investigation of the effectiveness of a new drug in treating a specific disease. Let's consider a hypothetical scenario: Suppose there is a pharmaceutical company that has developed a new medication intended to lower blood pressure in patients with hypertension. To determine the efficacy of the drug, a biostatistician may design and conduct a clinical trial. The trial involves recruiting a group of participants with hypertension and randomly assigning them into two groups: a treatment group receiving the new drug and a control group receiving a placebo (inactive substance). The biostatistician would collect relevant data from both groups, including baseline blood pressure measurements and subsequent measurements taken over a specified period of time. The collected data would include variables such as age, gender, medical history, and any other factors that could potentially influence the results...

What Is a Modern Analytics Ecosystem? - For an organization to remain competitive, the capacity to make defensible judgments using this data is essential. This is where a contemporary analytics ecosystem is useful. A contemporary analytics ecosystem is a full-featured platform that allows businesses to gather, handle, analyze, and display data in order to derive insightful conclusions. The details of a contemporary analytics ecosystem are covered in this article. Components of a Modern Analytics Ecosystem Data Collection and Integration The phase of data gathering and integration is at the core of a contemporary analytics ecosystem. Various sources, such as internal databases, external APIs, sensors, social media, and more, are used by organizations to collect data. This information is then combined, creating a single format that can be analyzed. A successful integration guarantees accurate, consistent, and current data...