Dashboard Software for Transportation Logistics
Looking for a dashboard software to track key performance indicators for large amounts of transportation logistics data, from one or multiple sources?
You've found the solution.
With InetSoft's StyleBI, analyzing Big Data is made easy, without any technical experience necessary. StyleBI allows the end-user to combine all types of data into one dashboard or report, and set key performance indicators to keep track of, with special exception alerts if metrics reach certain levels.
View your dashboards from anywhere, through a desktop, tablet or mobile device. With an administrator's permission, anyone can view or edit dashboards.

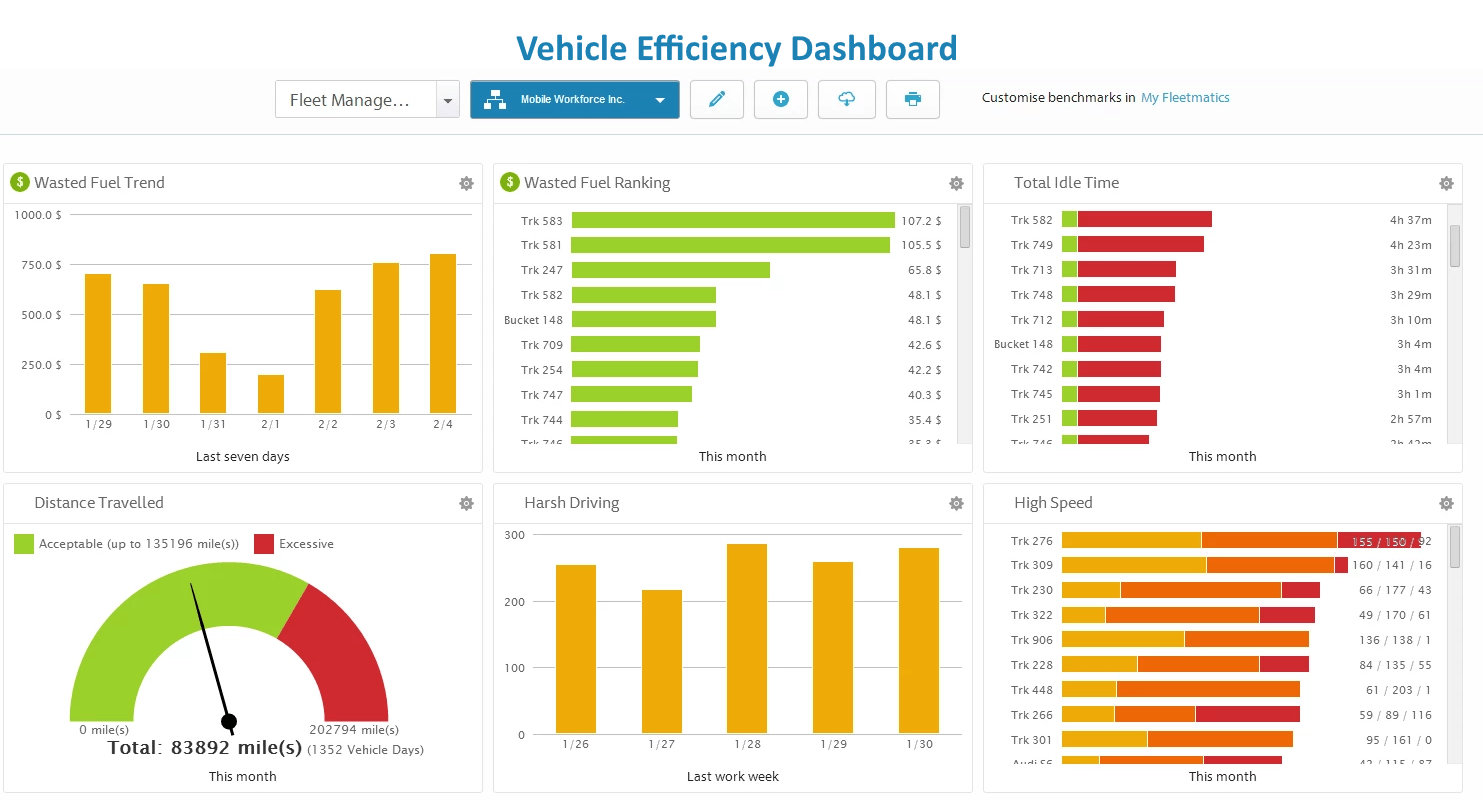
Spotlight on KPIs and Analyzing Logistics
Tracking key performance indicators in transportation logistics is just as important as in any other type of business. KPI's are essential business metrics important for keeping track of an organization's performance. Any organization needs to measure performance, whether it's on a daily, monthly, or on a quarterly basis. KPI's are the most important statistics that analyze an organization's objectives, business goals, and risks.
KPI dashboards for transportation logistics can easily be built with InetSoft's on-premise business intelligence software application, StyleBI. StyleBI offers drag and drop tools for creating a variety of chart types. Multiple KPI's can be tracked in a single report, which can include any of the various informational displays offered within the software.
Don't let all of this overwhelm you. As mentioned, building dashboards and reports does not require any technical skills. Your creations can be detailed but also robust, without any hassle.
Building dashboards to organize transportation logistics can include KPI's tracking progress in multiple areas, some examples being:
- On-time arrivals
- Percentage of shipments where quantity dispatched equals quantity received
- Percentage of shipments arriving in good condition
- Average delivery time from order time
- Average vehicle loading/unloading time
- Percentage of shipments using LTL/TL
- Freight cost per unit shipped
- Inbound freight costs as percentage of purchases
- Transit time
- Vehicle turnaround time
- Average number of stops per route
- Average transportation cost per miles/volume/weight
- Percentage of deadhead miles
- Claims as percent of freight costs
- Freight bill accuracy
- Accessories as percent of total freight
- Percent of truckload capacity utilized
- Number of carriers per shipment
- On-time pickups
What Analytics Does a Data Scientist at a Transportation Logistics Company Do?
A Data Scientist at a transportation logistics company plays a crucial role in leveraging data to drive business decisions and optimize operations. Here are some of the key analytics tasks that a Data Scientist in this domain might be involved in:
-
Route Optimization: Data Scientists analyze historical transportation data to identify optimal routes for shipments. This involves considering factors like distance, traffic patterns, delivery time windows, and cost constraints.
-
Demand Forecasting: They develop models to predict future demand for transportation services based on historical data, seasonal trends, market conditions, and other relevant factors. This helps in capacity planning and resource allocation.
-
Supply Chain Efficiency: Data Scientists work on optimizing the supply chain by analyzing data related to inventory levels, lead times, production schedules, and demand forecasts. They may use techniques like demand-supply matching and safety stock optimization.
-
Cost Analysis: They conduct cost-benefit analyses to evaluate the efficiency and profitability of different transportation options, including modes (e.g., road, rail, sea, air) and carriers. This helps in making informed decisions about carrier selection and cost-effective transportation strategies.
-
Performance Metrics and KPIs: Data Scientists define and track key performance indicators (KPIs) related to transportation operations. This may include metrics like on-time delivery rates, transit times, freight damage rates, and cost per mile/kilometer.
-
Customer Behavior Analysis: They analyze customer behavior patterns to understand preferences, delivery time expectations, and any recurring issues. This information helps in improving customer satisfaction and loyalty.
-
Risk Management and Compliance: Data Scientists assess risks associated with transportation operations, such as regulatory compliance, safety, and security. They develop models to identify potential risks and recommend mitigation strategies.
-
Geospatial Analysis: They utilize geospatial data to optimize transportation routes, plan distribution networks, and make location-based decisions. This includes considerations like proximity to suppliers, customers, and transportation hubs.
-
Environmental Impact Assessment: With a growing emphasis on sustainability, Data Scientists may analyze the environmental impact of transportation operations. This could involve evaluating options for reducing emissions, optimizing fuel efficiency, and adopting greener transportation methods.
-
Machine Learning for Predictive Maintenance: Data Scientists may develop predictive maintenance models for the transportation fleet. These models use sensor data to forecast when maintenance is needed, reducing unplanned downtime and ensuring fleet reliability.
-
Market Research and Competitor Analysis: They monitor market trends, competitor activities, and industry benchmarks to identify opportunities for improvement and innovation in transportation logistics.
-
Simulation and Scenario Analysis: Data Scientists may use simulation models to assess the impact of different strategies or scenarios on transportation operations. This helps in making informed decisions and preparing for unforeseen events.

More Articles About Using Dashboards in the Transportation Industry
Cost and Pricing Analytics for Freight Shippers - Transportation Cost per Unit: This statistic determines the cost of shipping each unit of cargo. Freight transport businesses may optimize pricing tactics and spot opportunities for cost-cutting by keeping an eye on this KPI. Freight Spend Analysis: Analyzing the total amount spent on freight services makes it possible to negotiate better rates with carriers, plan more efficient shipping routes, and reduce supply chain expenses...
Incident Severity KPIs - Incident severity is one of the most important KPIs in emergency management. This KPI is essential for evaluating the seriousness of the problem and figuring out how much action is needed. There are certain measures for determining the intensity of different sorts of emergencies: Natural Disasters: Severity measures often take into account variables like wind speed, fire intensity, or Richter scale magnitude for natural catastrophes like hurricanes, earthquakes, or wildfires. These indicators aid in the proper allocation of resources and provide a clear picture of the possible effect...
KPIs for Industrial Waste Management - The trash production rate is a crucial key performance indicator that measures the quantity of garbage generated in a certain period of time. It facilitates resource allocation and trash reduction initiatives by assisting companies in understanding the scope of their waste output. Businesses may spot patterns, anomalies, and inefficiencies in their waste generating operations by monitoring this KPI...

Security and Risk Management of Cargo - Risks to the security of the maritime sector include cargo theft and piracy. The efficacy of risk mitigation techniques, incident response procedures, and security measures is evaluated using KPIs and analytics pertaining to security and risk management. The platform can safeguard both the goods it moves and its assets by maintaining a high standard of security...
Using a Trellis Chart to Compare Stocked vs. Made-to-Order - A trellis chart of pie charts of each product category's stocked vs made to order ratio can be useful to a supply chain manager in several ways. By examining the stocked vs made to order ratio for each product category, the supply chain manager can identify which categories have a higher proportion of made to order items. This information can help the manager understand which categories require a more flexible inventory management strategy...