What KPIs Are Used by Freight Shipping Companies?
Companies that convey freight are essential to the transfer of products across borders. These businesses depend on analytics and key performance indicators (KPIs) to efficiently manage their operations and make wise choices.
This article seeks to provide a thorough list of the KPIs and analytics often used by freight shipping firms, assisting them in streamlining their operations, boosting productivity, and raising customer satisfaction.

On-time Delivery Metrics
- On-time Delivery Percentage: This KPI calculates the proportion of shipments that arrive within the set window of time. Potential delays are spotted, carrier performance is evaluated, and overall customer satisfaction is calculated.
- Transit Time: Setting reasonable delivery expectations is made easier by keeping track of the typical amount of time it takes for goods to travel from their point of origin to their final destination.
- Carrier Performance Metrics: Freight shipping firms may choose the most dependable and effective partners by comparing the performance of several carriers based on their on-time delivery, average travel time, and dependability data.
Cost and Pricing Analytics
- Transportation Cost per Unit: This statistic determines the cost of shipping each unit of cargo. Freight transport businesses may optimize pricing tactics and spot opportunities for cost-cutting by keeping an eye on this KPI.
- Freight Spend Analysis: Analyzing the total amount spent on freight services makes it possible to negotiate better rates with carriers, plan more efficient shipping routes, and reduce supply chain expenses.
- Rate of Return: This KPI calculates the proportion of shipments that are returned due to issues like consumer complaints or product flaws. Analyzing return rates enables the reduction of expenses related to returns and the identification of areas for improvement.
Operational Efficiency Metrics
- Empty Mileage: Monitoring the distance covered by empty trucks or containers may provide you information about how well routes and load planning are planned. Getting rid of empty miles helps to cut carbon emissions and maximize fuel efficiency.
- Dwell Time: This KPI calculates the amount of time that shipments spend in different supply chain locations, such as terminals or warehouses. Analyzing dwell time helps in identifying bottlenecks and process optimization for increased throughput.
- Pick-Up and Delivery Times: Freight transportation businesses may evaluate operational effectiveness, spot possible delays, and enhance overall service quality by tracking the time it takes for pick-ups and deliveries.

Inventory and Warehouse Management
- Inventory Turnover: This indicator counts the instances during which inventory is sold and replenished. Increased turnover denotes effective inventory control, which lowers holding costs and lowers the danger of item obsolescence.
- Warehouse Capacity Utilization: Optimizing storage layouts, streamlining procedures, and lowering the cost of acquiring extra facilities are all benefits of analyzing how efficiently warehouse space is being used.
- Order Fulfillment Accuracy: This KPI tracks the proportion of orders that are properly chosen, packaged, and sent in order to evaluate the accuracy of order fulfillment. It guarantees client happiness and minimizes returns or reshipments.
Customer Service Metrics
- On-time Pickup Percentage: Monitoring the proportion of deliveries that are picked up on time enables one to evaluate a carrier's dependability and satisfy consumer demands for prompt delivery.
- Delivery Performance Index: This indicator incorporates multiple elements, such as on-time delivery, delivery accuracy, and customer feedback, to assess how well the freight transportation firm performs overall in satisfying customer needs.
- Customer Satisfaction Surveys: Surveying consumers' opinions enables businesses to monitor customer happiness, pinpoint problem areas, and improve service quality.
Risk and Compliance Metrics
- Compliance Rate: This indicator assesses the degree to which regulatory obligations and industry standards are being complied with. It reduces the possibility of fines or interruptions by ensuring that freight transportation businesses follow rules and regulations.
- Safety Performance: Analyzing safety-related events, such as accidents or injuries, enables risk management procedures to be improved and the efficacy of safety policies to be tracked.

Sustainability Metrics
- Carbon Emissions: Companies may evaluate their environmental effect and create plans for emission reduction via route optimization, fuel economy, and alternative energy sources by tracking the carbon emissions produced by transportation-related operations.
- Fuel Efficiency: It is possible to find possibilities to increase fuel economy, save expenses, and minimize environmental impact by tracking fuel use and studying efficiency measures like gasoline used per ton-mile.
Equipment Utilization
- Container Utilization Rate: This number gauges how much of a container's capacity is used during transit. Utilizing containers to their full potential assures effective equipment usage, lowers transportation costs, and decreases carbon emissions.
- Truck Utilization: Monitoring the amount of truck capacity that is really being used enables freight transport firms to more effectively schedule loads, allocate resources, and run their businesses.
Claims and Damage Control
- Claim Rate: This KPI calculates the proportion of shipments that generate claims for theft, loss, or damage. Analysis of claim rates reveals possibilities for improvement in risk management, handling, and packing procedures.
- Damage Rate: Monitoring the proportion of cargo damaged in transit enables one to assess carrier performance, find the underlying causes of damage, and put preventative measures in place.

Supply Chain Visibility
- Track and Trace Accuracy: This KPI assesses the precision and dependability of shipment tracking and tracing throughout the supply chain. It promotes openness, reduces shipping inconsistencies, and enhances supply chain visibility generally.
- Real-time Monitoring: Freight transportation businesses may track cargo locations, conditions (including temperature and humidity), and security in real-time by using technology like IoT (Internet of Things) sensors and GPS tracking. This allows proactive decision-making and risk reduction.
Performance Benchmarking
- Industry Comparisons: Freight transportation firms may assess their competitiveness, pinpoint areas for development, and establish reasonable performance goals by comparing performance data with industry standards and best practices.
- Historical Performance Analysis: Companies may evaluate their performance over time, spot trends, and make educated choices based on previous patterns by analyzing historical data on KPIs.
Shipment Visibility and Tracking
- On-time Shipment Tracking: This statistic counts the proportion of shipments that can be precisely and immediately traced. It promotes visibility throughout the transportation process, allowing prompt action when required and proactive decision-making.
- Delivery Status Updates: Businesses may give consumers with timely and accurate information by analyzing the frequency and accuracy of delivery status updates, increasing transparency and customer happiness.

Capacity Planning
- Equipment Utilization Rate: Monitoring the proportion of equipment capacity used makes it easier to evaluate the effectiveness of resource allocation, spot potential consolidation or growth possibilities, and maximize equipment use for cost savings.
- Demand Forecast Accuracy: Freight transport businesses may more efficiently manage their capacity needs by evaluating the accuracy of demand forecasting models, reducing overcapacity or undercapacity situations.
Network Optimization
- Route Optimization: Using historical data and current traffic information, shipping routes may be improved to shorten transit times and use less fuel. These strategies are also essential for shipping cars efficiently, helping reduce transit times, optimize carrier routes, and improve overall transportation reliability.
- Network Cost Analysis: It is possible to find chances for cost reduction, network optimization, and operational efficiency by evaluating the operating costs of different transportation routes, hubs, and facilities.
Customer Retention and Loyalty
- Customer Retention Rate: This indicator counts the proportion of clients who utilize the freight shipping company's services for an extended time. It aids in evaluating client loyalty, pinpointing problem areas, and enhancing client retention tactics.
- Net Promoter Score (NPS): A statistic known as NPS asks consumers how likely they are to refer the firm to others in order to gauge their happiness and loyalty. Understanding general customer sentiment and identifying areas for development are both aided by NPS analysis.

Vendor Performance
- Carrier Performance Scorecard: The development of scorecards to assess carrier performance based on aspects including on-time delivery, damage rates, and customer feedback supports programs for continuous improvement, contract negotiations, and vendor selection.
- Supplier Performance Metrics: Freight transport firms may improve their supplier relationships and guarantee constant service levels by evaluating the performance of their suppliers in areas like dependability, responsiveness, and quality of services.
Financial Analysis
- Revenue per Shipment: This measure determines the typical revenue per shipment. Analyzing revenue per shipment aids in the evaluation of pricing tactics, the identification of high-value clients or market niches, and the optimization of revenue creation.
- Profitability Analysis: It is possible to pinpoint locations with high profitability and adjust resource allocation appropriately by evaluating the profitability of various shipping routes, client segments, or services.
Employee Performance and Efficiency
- Labor Productivity: The production or value produced per worker or per hour worked is measured by this statistic. Analyzing labor productivity aids in evaluating staff effectiveness, identifying areas that need training, and enhancing operational performance.
- Employee Satisfaction: Assessing employee satisfaction levels, identifying areas for development, and fostering a pleasant workplace culture are all facilitated by gathering input from workers through surveys or performance reviews.
Shipping Performance Definition
Shipping performance metrics measure how efficiently, accurately, and reliably goods move through the shipping process from order creation to final delivery. These metrics help logistics managers, carriers, warehouse teams, and 3PLs evaluate delivery speed, cost efficiency, accuracy, and customer satisfaction.
Unlike freight-only KPIs, shipping performance metrics apply across all shipping modes—parcel, freight, LTL, FTL, regional carriers, national carriers, ground, and air. They provide a complete view of how well shipping operations meet customer expectations and business goals.
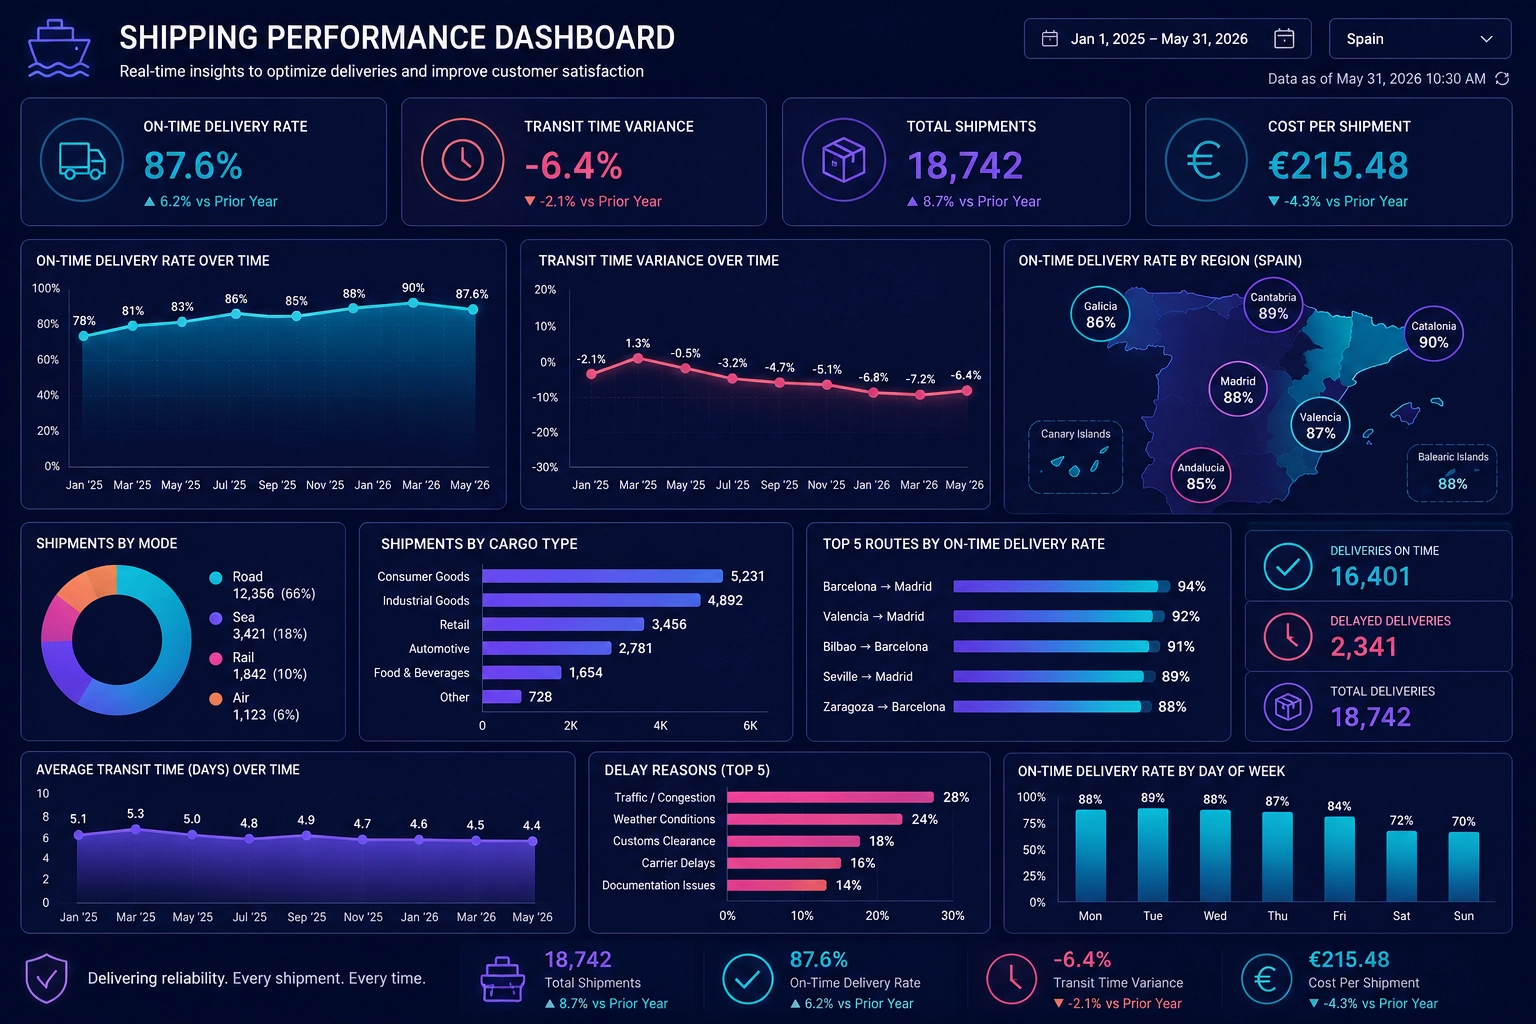
Core Shipping Performance Metrics
These metrics represent the most important indicators of shipping reliability, speed, cost, and quality. They combine traditional freight KPIs with broader cross-modal shipping metrics.
- On-Time Delivery Rate: Percentage of shipments delivered by the promised date. A universal measure of shipping reliability.
- Delivery Accuracy: Measures whether shipments arrive at the correct address with the correct items. Critical for customer satisfaction.
- Transit Time Variance: Tracks consistency of delivery speed. High variance indicates unpredictable carrier performance.
- Order Cycle Time: Total time from order placement to final delivery. Includes processing, picking, packing, dispatch, and transit.
- Perfect Order Rate: Percentage of orders delivered on time, complete, undamaged, and accurately documented.
- Cost per Package / Cost per Mile: Measures shipping cost efficiency across parcel and freight shipments.
- Damage Rate: Percentage of shipments arriving damaged. A key quality metric for carriers and packaging processes.
- Customer Satisfaction Score (CSAT): Post-delivery feedback measuring customer experience with shipping speed, accuracy, and condition.
- Carrier Performance Score: Composite score comparing carriers on speed, accuracy, cost, and damage rate.
- Freight KPIs (Original Content): Includes cost per shipment, on-time freight delivery, freight spend, and load utilization—still relevant but now part of a broader performance framework.
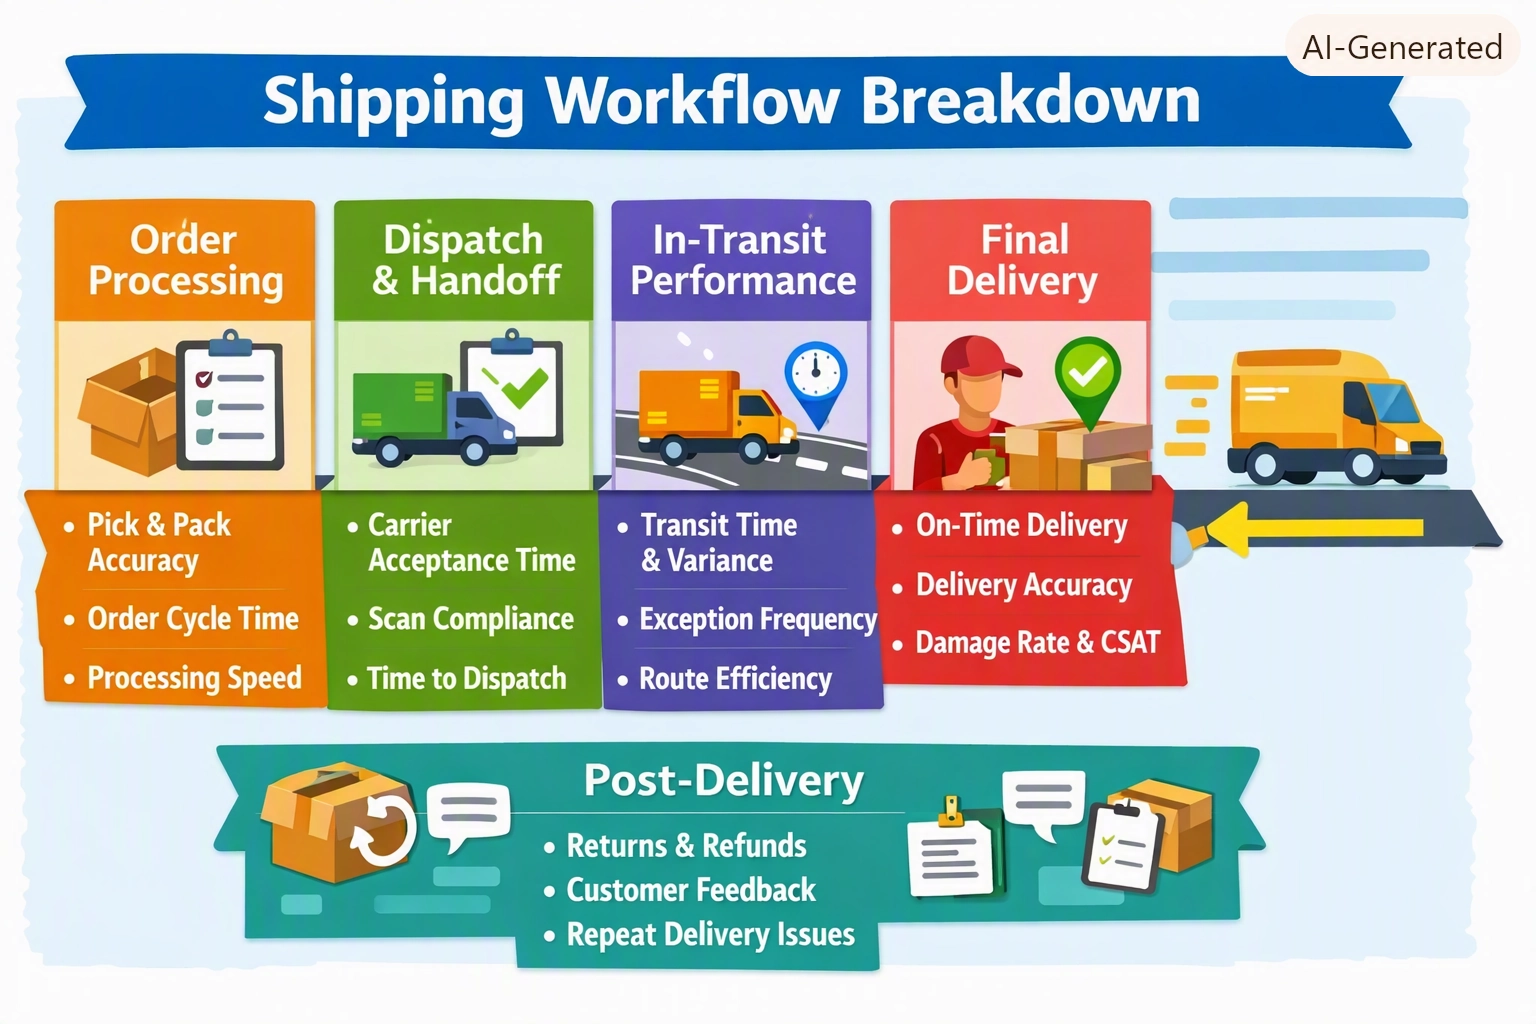
Shipping Workflow Breakdown
Shipping performance metrics map to each stage of the shipping workflow. Breaking down the workflow helps identify bottlenecks and optimize end-to-end performance.
- Order Processing: Includes order cycle time, pick accuracy, pack accuracy, and processing speed.
- Dispatch & Handoff: Measures carrier acceptance time, scan compliance, and time-to-dispatch.
- In-Transit Performance: Covers transit time, transit time variance, exception frequency, and route efficiency.
- Final Delivery: Includes on-time delivery rate, delivery accuracy, damage rate, and customer satisfaction.
- Post-Delivery: Tracks returns, return reasons, customer feedback, and repeat delivery issues.
This workflow-based structure helps teams understand where delays, errors, or inefficiencies occur and how they impact overall shipping performance.
Shipping Performance FAQs
What are shipping performance metrics?
Shipping performance metrics measure delivery speed, accuracy, cost efficiency, and customer satisfaction across all shipping modes. They help logistics teams evaluate how well shipping operations meet service expectations.
How do shipping performance metrics differ from freight KPIs?
Freight KPIs focus on freight-specific operations such as load utilization and freight spend. Shipping performance metrics are broader and include parcel delivery, customer satisfaction, delivery accuracy, and workflow-based performance indicators.
Which shipping performance metrics matter most?
Key metrics include on-time delivery rate, delivery accuracy, transit time variance, perfect order rate, cost per package, damage rate, and customer satisfaction scores.
How do you measure delivery accuracy?
Delivery accuracy is measured by comparing the intended delivery address and items with the actual delivery results. Incorrect addresses, missing items, or wrong items reduce accuracy.
What affects transit time variance?
Transit time variance is influenced by carrier performance, route efficiency, weather conditions, regional capacity constraints, and operational delays during dispatch or sorting.
How do shipping metrics reduce costs?
Shipping metrics highlight inefficiencies such as slow processing, inaccurate picking, poor carrier performance, and high damage rates. Addressing these issues reduces rework, returns, and shipping spend.
How do carriers compare on shipping performance?
Carriers are compared using composite scores that include on-time delivery, transit time variance, damage rate, cost per package, and customer satisfaction. This helps businesses choose the best carrier for each shipping profile.