Analytics Used by Different Industries
Learn about what types of analytics are used by different industries. Read these articles to understand why they choose the metrics that they analyze:
What Key Performance Indicators Do Hospital Operations Analysts Use? - Hospital operations personnel must report out on areas for improvement or correction for upper management. These professionals use key performance indicators (KPIs) and analytics to assess and track the performance of their hospitals in order to make educated choices. In this article, we will cover the key performance indicators (KPIs) and analytics that are used by hospital operations experts. Patient satisfaction is one of the most important KPIs for hospital operations experts. Because they gauge how successfully hospitals are serving patients' needs and expectations, patient satisfaction measures are crucial. Patient satisfaction may be measured in a number of ways, including via surveys, feedback forms, and other means. To assess the level of care and support offered by their hospitals, hospital operations professionals utilize these criteria...
What Kinds of Analyses Does an Epidemiologist Do? - Epidemiologists are public health professionals who study the distribution and determinants of health and disease in populations. They conduct a wide range of analyses to investigate patterns, trends, and risk factors associated with infectious and non-infectious diseases. Here are some common types of analyses that epidemiologists perform: Descriptive Epidemiology: Epidemiologists analyze demographic data, such as age, gender, race/ethnicity, and geographic location, to describe the distribution of diseases within populations. Descriptive epidemiology provides insights into disease occurrence, prevalence, and disparities across different demographic groups. Disease Surveillance: Epidemiologists monitor and analyze disease surveillance data from healthcare facilities, laboratories, and public health agencies to detect outbreaks, track disease trends over time, and identify emerging health threats. They use surveillance data to assess disease burden, geographic spread, and temporal patterns of diseases. Outbreak Investigations: During disease outbreaks, epidemiologists conduct investigations to determine the source of infection, identify affected individuals, and implement control measures to prevent further transmission...
What Kind of Analytics Do Actuaries Perform? - Actuaries create risk categories and design models to minimize the damage when undesirable events do occur. Actuaries also help make strategic decisions and communicate solutions for complex financial issues. Actuaries can work in various types of companies, such as insurance, consulting, government, hospitals, banks, and investment firms. They typically specialize in one field of insurance, such as health, life, property, casualty, or pension. Actuaries also perform actuarial analysis, which is a form of asset-to-liability analysis that ensures they have the funds to pay the required liabilities.Some of the analytics initiatives that actuaries are involved in are marketing and distribution, pricing and underwriting, claims and fraud, and customer retention and loyalty. Actuaries use data from various sources and apply advanced statistical techniques to provide insights and recommendations for these initiatives...
What Kind of Data Analyses Do Chemical Manufacturing Companies Do? - Chemical manufacturing companies engage in a wide range of data analyses to optimize their processes, ensure product quality, manage resources efficiently, and make informed business decisions. Here are several types of data analyses commonly performed in the chemical manufacturing industry: Process Optimization: Statistical Process Control (SPC): Monitors and controls manufacturing processes by analyzing data in real-time, ensuring that variations stay within acceptable limits. Six Sigma Analysis: Aims to minimize defects and variations in production processes to improve efficiency and quality. Quality Control: Chemical Analysis: Involves the use of analytical techniques to verify the composition and purity of raw materials, intermediates, and final products. Quality Assurance (QA): Analyzing data to ensure that products meet specified quality standards and regulatory requirements. Supply Chain Management: Demand Forecasting: Uses historical data and predictive analytics to estimate future product demand, helping companies optimize inventory levels. Logistics Optimization: Analyzing transportation and distribution data to enhance efficiency in the supply chain. Energy Management: Energy Consumption Analysis: Identifying areas of high energy consumption and implementing measures to reduce energy usage, which can lead to cost savings and environmental benefits...
What Kinds of Analyses Are Done on Voter Registration Big Data? - Analyzing voter registration big data involves a range of sophisticated techniques and methodologies aimed at understanding voter behavior, demographics, preferences, and patterns. Here are some of the key types of analyses typically performed on voter registration big data: Demographic Analysis: Understanding the demographic composition of registered voters, including age, gender, race, ethnicity, education level, income, and geographic location. Identifying demographic trends and shifts over time, which can inform political strategies and outreach efforts. Geospatial Analysis: Mapping voter registration data to visualize the distribution of registered voters across different geographic regions, such as states, counties, cities, and precincts. Identifying areas of high voter concentration, swing regions, and demographic trends within specific geographic boundaries. Voter Turnout Analysis: Analyzing voter turnout rates based on historical election data and voter registration records. Identifying factors that influence voter turnout, such as demographics, socioeconomic status, political affiliation, and the presence of competitive races...

What KPIs and Analytics Are Used on an Air Quality Dashboard? - Air quality management and monitoring have become critical. Air quality dashboards, which provide data and insights on the condition of our atmosphere in real time, have become very useful tools with the emergence of smart technology. This article explores the complex world of analytics and Key Performance Indicators (KPIs) used on air quality dashboards, providing insight into the measures and metrics that inspire decisions for a healthier, cleaner atmosphere. The monitoring of particulate matter concentrations is the central component of any air quality dashboard. Particulate matter, or PM for short, is the term used to describe minute particles or droplets in the air that may enter the lungs by inhalation. The concentrations of these different sized particles are important markers of the quality of the air. PM1, PM2.5, and PM10 KPIs are often used to measure PM concentrations. These three categories correspond to particles with dimensions of 1, 2.5, and 10 micrometers, respectively. Monitoring these levels directs regulatory efforts to reduce pollution and assists in evaluating the possible health concerns linked to breathing in particle matter...

What KPIs and Analytics Are Used by a Billing Operations Analyst? - Accurate and efficient management of financial transactions is important for the success of any organization. To ensure smooth billing processes and identify areas for improvement, Billing Operations Analysts rely on key performance indicators (KPIs) and analytics. These metrics and analytical tools enable them to assess the performance of billing operations, identify trends, and make data-driven decisions. In this article, we will explore a comprehensive list of KPIs and analytics commonly used by Billing Operations Analysts. Accuracy and Timeliness KPIs Billing Accuracy Rate Percentage of accurate invoices generated within a specified timeframe. Helps assess the precision of billing processes and identify potential errors. Invoice Error Rate Measures the frequency of errors in generated invoices. Enables identification of recurring issues and highlights areas for process improvement. Billing Cycle Time Time taken to complete the billing process from start to finish. Helps assess operational efficiency and identifies bottlenecks in the billing workflow...
What KPIs and Analytics Are Used on Building Power Management Dashboards? - Ensuring dependable and effective energy generation is crucial. To monitor and manage their operations, power production businesses and utility providers use a variety of key performance indicators (KPIs) and analytics. Power generating dashboards, which provide a thorough and up-to-date picture of the whole power production process, are essential to this effort. This article examines the statistics and KPIs that are often shown on dashboards for power generating and discusses their importance in the energy industry. One of the key performance indicators (KPIs) in power management is the overall energy usage. It shows the total energy used by a facility over a certain time frame and is often expressed in kWh. Organizations may establish baseline consumption levels and monitor advances in energy efficiency by keeping an eye on this KPI. The quantity of energy used per square footage or unit of output is measured by energy intensity. It's an essential KPI for evaluating energy efficiency across various facilities and benchmarking, allowing one to pinpoint failing or high-performing assets...
What KPIs and Analytics Are Used on Calibration Management Software Dashboards? - Quality control and compliance in numerous sectors depend on calibration management to ensure accurate measuring devices and equipment. Calibration Management Software (CMS) is essential for optimizing and simplifying the calibration process in today's high-tech environment. These software systems provide detailed dashboards that show calibration actions. The crucial analytics and Key Performance Indicators (KPIs) utilized in dashboards for Calibration Management Software will be covered in detail in this article. Monitoring and managing the calibration state of instruments and equipment is the main function of a Calibration Management Software. The current state of equipment calibration is one of the most visible KPIs on CMS dashboards. This KPI gives a brief summary of the number of instruments that need to be calibrated, the number that is in process, and the number that is past due. By analyzing this data, companies may lower the risk of erroneous measurements that might affect product quality and regulatory compliance and guarantee that all equipment are calibrated on time...

What KPIs and Analytics Are Used on Capital Program Management Dashboards? - Through effective resource allocation, risk management, and project success assurance, capital program management plays a critical role in guiding enterprises towards their strategic goals. Key Performance Indicators (KPIs) and analytics are becoming essential tools for decision-makers in this changing environment. Data-driven decision-making is made possible by capital program management dashboards, which are driven by pertinent KPIs and analytics and provide real-time insights. We will examine the importance and effect of the key KPIs and analytics used on capital program management dashboards in this article. The Budget Variance is a key performance indicator (KPI) used in capital program management. It calculates the gap between anticipated and actual expenses, assisting businesses in finding disparities and swiftly addressing them. This KPI is shown in real time on dashboards, which helps project managers keep tabs on expenses and avoid going over budget...
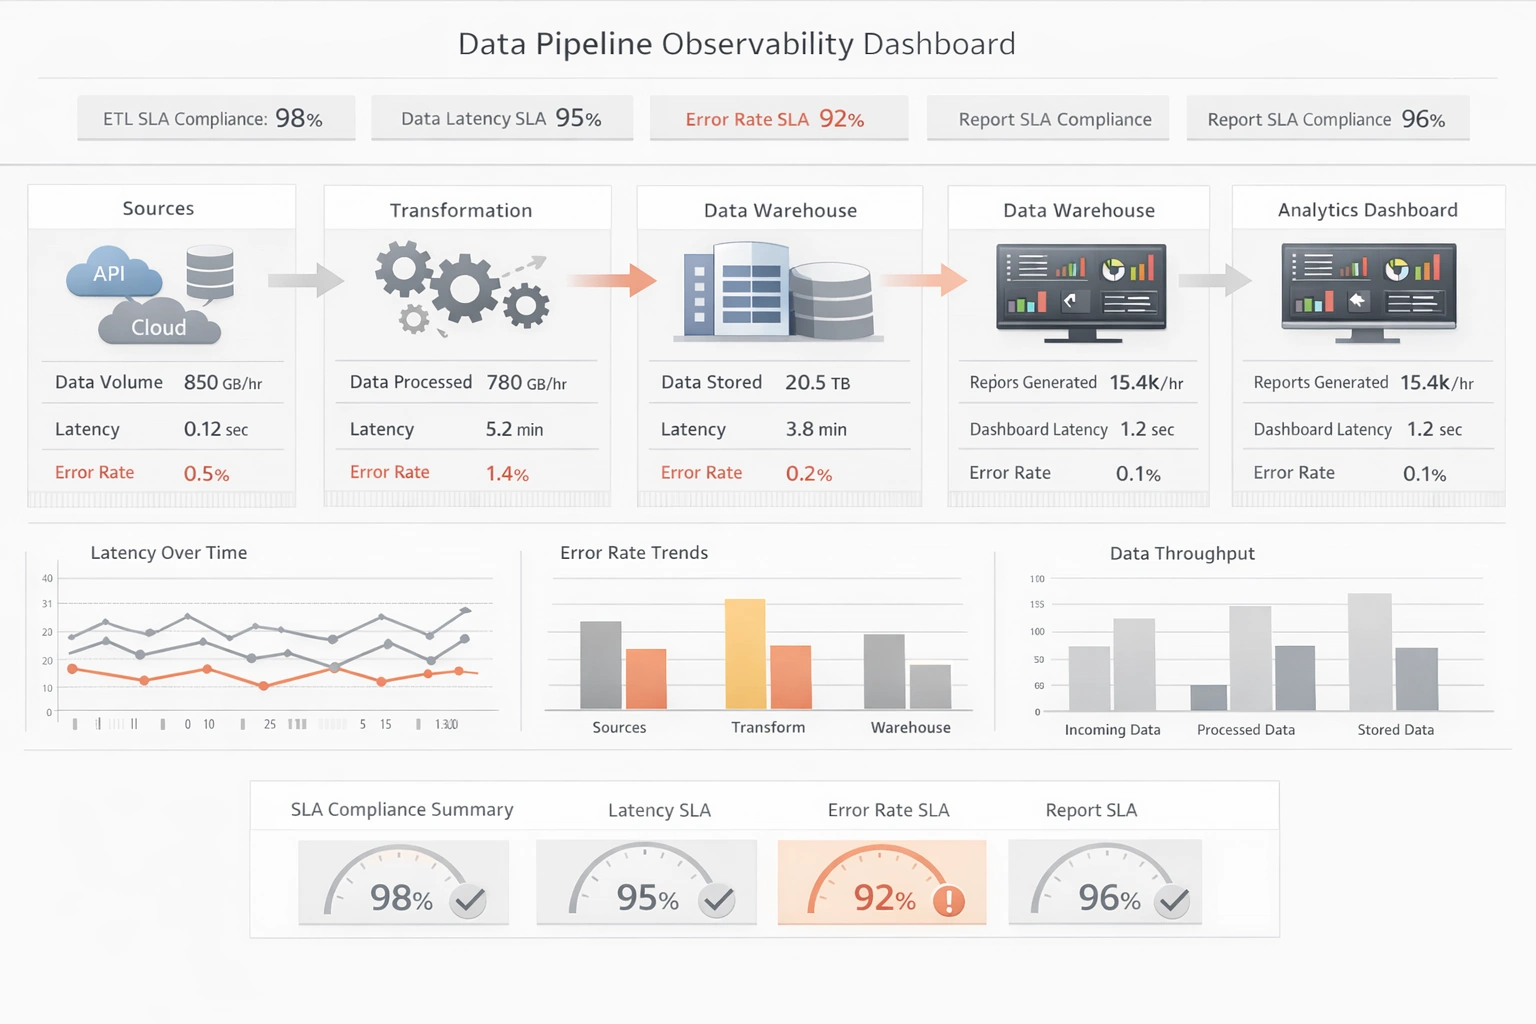
What KPIs and Analytics Are Used on Data Pipeline Monitoring Dashboards? - Data pipelines are the backbone of modern analytics systems, moving and transforming raw data into actionable insights for business intelligence, reporting, and machine learning workflows. Monitoring these pipelines is crucial for ensuring reliability, performance, and accuracy. A data pipeline monitoring dashboard provides developers, data engineers, and analysts with real-time visibility into pipeline health, operational performance, and data quality. Understanding the key metrics tracked on these dashboards, what they mean, and how to influence them is essential for optimizing pipeline operations and preventing costly disruptions. Pipeline throughput measures the volume of data processed by a pipeline over a given period, typically expressed in records per second, megabytes per second, or events per minute. High throughput indicates that the pipeline is efficiently handling data volumes, while low throughput may signal bottlenecks or resource constraints. Throughput can be influenced by optimizing data transformations, increasing parallelism in processing tasks, and tuning the underlying infrastructure, such as allocating more CPU or memory resources to compute nodes. Monitoring throughput allows teams to detect performance degradation before it affects downstream analytics or dashboards.
What KPIs and Analytics Are Used on Data Risk Dashboards? - Enterprises have never-before-seen difficulties in safeguarding and controlling their data against diverse threats. In this situation, a Data Risk Dashboard is essential because it gives businesses a thorough picture of the risks and weaknesses they face. These dashboards must include analytics and Key Performance Indicators (KPIs) in order to efficiently monitor and reduce data risks. We will examine the particular KPIs and analytics used on a Data Risk Dashboard in this article, as well as how they support an effective data risk management plan. Number and severity of data breach occurrences are the primary KPIs on a Data Risk Dashboard. This indicator gives a quick overview of how effectively a company protects its critical data. Usually, the dashboard shows trends over time, enabling stakeholders to see trends and evaluate the effectiveness of security precautions. A rise in data breach instances might be a sign of vulnerabilities that need quick fix...
What KPIs and Analytics Are Used on Digital Experience Platform Dashboards? - Success on your website or application depends on your ability to comprehend user behavior and engagement. Digital Experience Platforms, or DXPs, are now considered to be very effective tools for managing and improving an organization's online presence. DXPs deliver significant insights via dashboards that show KPIs and statistics. This article discusses KPIs and analytics on digital experience platform dashboards and the metrics and data points used to assess and enhance digital experiences. Any digital experience revolves on user engagement, and DXPs assist businesses in measuring it successfully. Typically, DXP dashboards incorporate the following KPIs to evaluate user engagement: Page Views: The number of times a certain page has been seen on a website or application is indicated by page views. Tracking page views makes it easier to determine which material is well-liked and which can need some enhancement. Session Duration: The length of a session offers information on how long visitors spend on a website or application in one session. Extended session times are often linked to increased user involvement...
What KPIs and Analytics Are Used on Earthwork Estimating Software Dashboards? - An essential stage of building projects is earthwork estimates, which calls for accuracy and productivity. Earthwork estimate software has become essential to the upheaval in the construction sector brought about by the integration of technology in the digital era. The dashboard, which displays KPIs and statistics, is a significant aspect of many software systems. This article discusses earthwork estimating software dashboard KPIs and analytics, showing how they help construction professionals make educated choices and maximize project results. Because earthwork projects must be completed on time, it is essential to track project progress in order to fulfill deadlines and maintain a seamless construction process. The statistics and KPIs listed below are essential for monitoring the progress of a project. This statistic contrasts the volume of excavation that actually occurred with the aim that was set. A departure from the anticipated volume may indicate impending delays or inefficiencies, necessitating immediate remedial action...
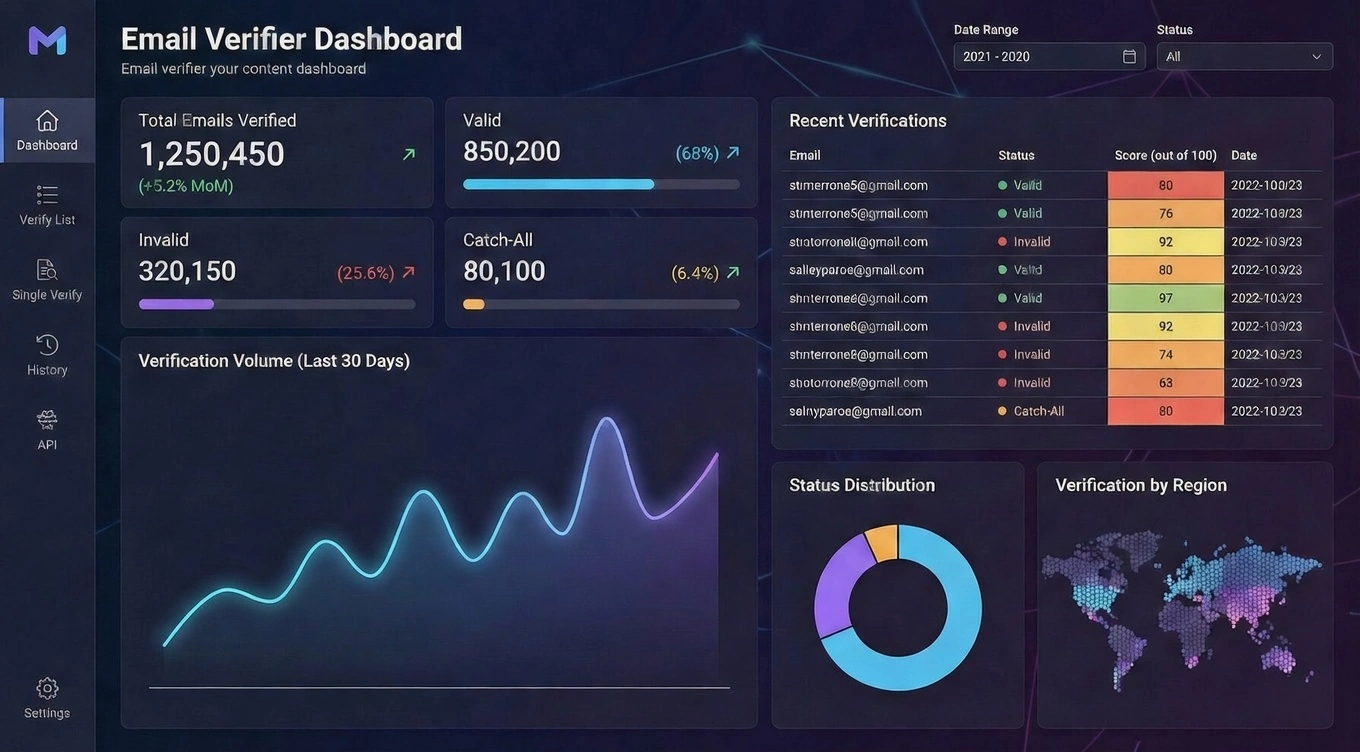
What KPIs and Analytical Metrics Are Used in an Email Verifier? - The metrics and KPIs which will represent the efficiency of email verification systems like Lets Extract Email Verifier shall be a prime aspect to consider. Businesses that maintain strong relationships with their customers by marketing via email must always be on top of these metrics as they provide them with ways to gauge effectiveness, efficiency and accuracy of the tool. The metrics of email marketing success can be measured from the current size of email lists, the state of data gathering processes, and the efficiency of their promotional efforts. Companies might use factors such as success rate, bounce rate, and catch-all formalities to optimize their marketing efforts, which in turn reduce expenditure because of unmanaged emails. These metrics pertinent for marketing strategy, as they lead to the increase of return on investment (ROI), sender reputation, and compliance with legislations aimed against spamming...
What KPIs and Analytics Are Used on Heavy Construction Software Dashboards? - The use of technology has become essential in the field of heavy construction, where projects are large and complex. A key feature of this technology revolution is the use of specialist software dashboards designed for large-scale building projects. These dashboards simplify operations and show project performance using KPIs and analytics. This article discusses heavy construction software dashboard KPIs and analytics and how they improve project management and decision-making. Types of Heavy Construction Projects Highway and Road Construction: Description: This involves the construction, expansion, or maintenance of highways, expressways, and local roads. Significance: Improved road networks enhance transportation, reduce congestion, and stimulate economic development. Bridge Construction: Description: Building, repairing, or upgrading bridges that span bodies of water, highways, or other obstacles. Significance: Bridges facilitate transportation and connect regions, contributing to economic integration. Tunnel Construction: Description: Excavating and constructing tunnels for transportation (such as subways) or utility purposes. Significance: Tunnels provide efficient transportation options and enable infrastructure development in densely populated areas. Airport Construction: Description: Building or expanding airports, including runways, terminals, and associated infrastructure. Significance: Modern airports are essential for global connectivity and economic development...
What KPIs and Analytics Are Used on Help Desk Software Dashboards? - Help desk software has evolved into a vital tool for customer care departments striving to provide top-notch assistance. The intelligent use of analytics and Key Performance Indicators (KPIs) on user-friendly dashboards is critical to these systems' effectiveness. The importance of these measures is examined in this article, along with the particular KPIs and analytics that drive help desk software dashboards. Dashboards for help desk software work as mission control centers by providing a thorough picture of client interactions and support procedures. These dashboards are intended to improve communication, expedite process, and provide useful information. The use of analytics and Key Performance Indicators (KPIs) is what makes these dashboards so powerful. Ticket resolution time is one of the most important KPIs in help desk software dashboards. The average time it takes support staff to address client concerns is gauged by this statistic. Prolonged periods may suggest bottlenecks or resource limits, whereas lower resolution times imply efficiency and rapid customer response...

What KPIs and Analytics Are Used on Home Builder CRM Software Dashboards? - CRM software for home builders is essential for managing connections, streamlining operations, and growing the construction sector. Integrating analytics and Key Performance Indicators (KPIs) into these CRMs' dashboards is one of the key components that drives their efficacy. This article explores the particular KPIs and statistics that are essential for improving performance and decision-making in the house construction industry. Any CRM system for house builders must be centered on the need to monitor and enhance sales performance. A range of key performance indicators and analytics are used in the evaluation and improvement of sales force efficacy. Among them are: Lead Conversion Rates: Measuring the proportion of leads that turn into clients gives valuable information about how well the sales funnel is working. Sales Velocity: This KPI calculates how long it takes a lead to pass through the sales funnel in order to pinpoint areas that need work and identify bottlenecks. Opportunity Win Rates: Better forecasting and resource allocation are made possible by having an understanding of the success rates of converting possibilities into completed transactions...
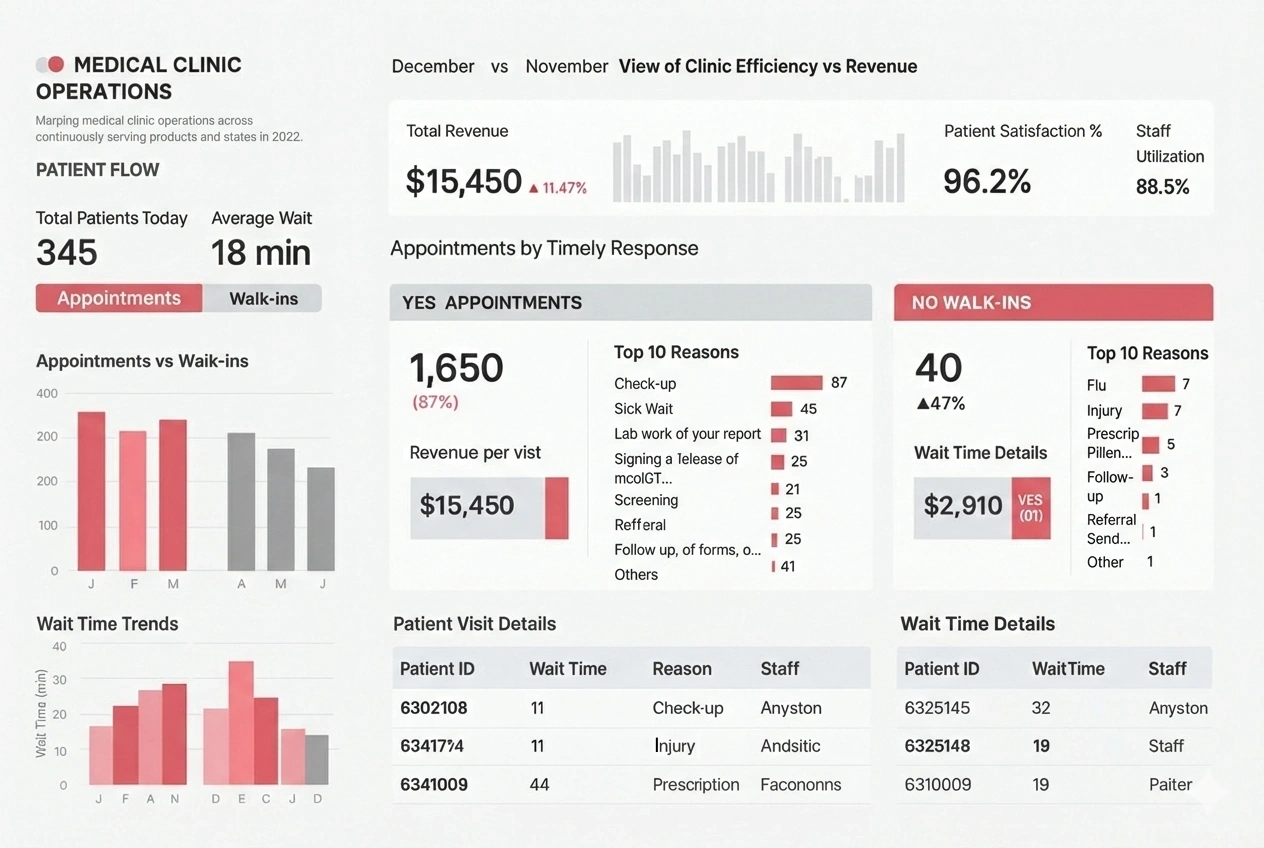
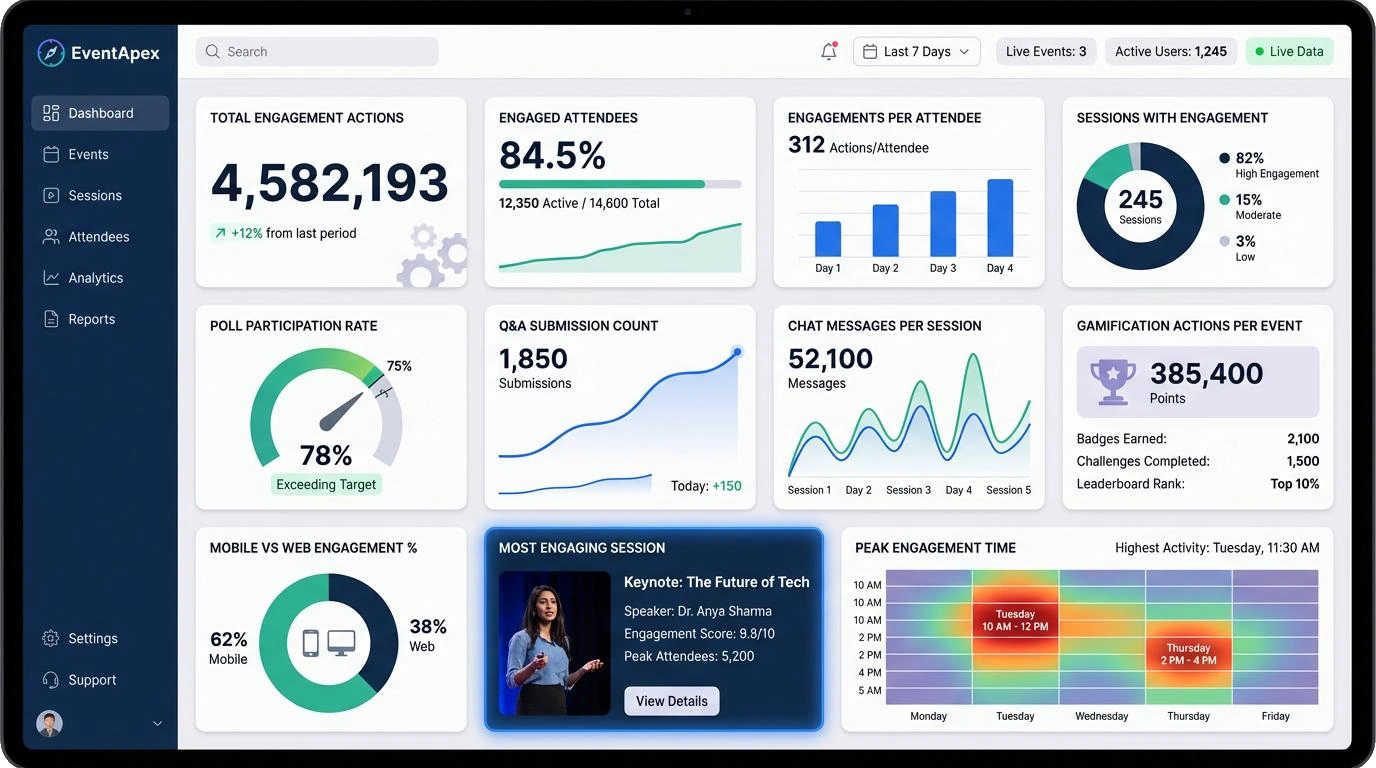
What KPIs and Analytics Are Used on Medical Clinic Operations Dashboards? - Medical clinics require efficient operations management to provide quality patient care while optimizing resources. Medical clinic operations dashboards use Key Performance Indicators (KPIs) and analytics to monitor and improve operational performance. These dashboards provide real-time visibility into critical metrics that impact patient satisfaction, staff efficiency, and financial health. This article explores the essential KPIs and analytics used on medical clinic operations dashboards. Patient Wait Time is a critical KPI that measures the average time patients wait from arrival until they are seen by a healthcare provider. Long wait times negatively impact patient satisfaction and clinic reputation. By monitoring wait time analytics, clinic managers can identify bottlenecks in scheduling, staffing, or facility flow and implement improvements to reduce delays and enhance the patient experience. Appointment Utilization Rate measures the percentage of scheduled appointments that are actually completed. This KPI helps clinics optimize their scheduling practices, reduce no-shows, and improve resource allocation. High utilization rates indicate efficient use of provider time and clinic capacity, while low rates may signal scheduling issues or patient engagement problems that need to be addressed...
What KPIs and Analytics Are Used on Home Health Provider Software Dashboards? - With its comprehensive approach to patient care management, home health provider software has completely transformed the healthcare sector. KPIs and analytics on software dashboards provide providers real-time information, improving decision-making and care. We explore the essential KPIs and statistics used in home health provider software dashboards in this article. The first step in effective patient management is monitoring admissions and discharges. Dashboards created by home health providers using software provide up-to-date information on patients who are starting treatment and those who are finishing it. This KPI guarantees a smooth transition between patient care phases and helps providers use resources optimally. Ensuring the faithfulness of a care plan is essential to providing high-quality medical treatment. Dashboards created by home health software provide information on how successfully caregivers and patients adhere to treatment programs. This KPI may be analyzed to help find areas that need improvement, enhance patient outcomes, and make sure that the treatment being provided complies with set guidelines...

What KPIs and Analytics Are Used on InfinitePay Dashboards? - Effective decision-making in contemporary business is dependent on a thorough comprehension of a company's performance. A strong dashboard with KPIs and analytics is essential for financial transaction leader InfinitePay who enables payments to be made swiftly and securely, whether they are online, in-store, or even across borders This article discusses income, sales, customer acquisition, and other key InfinitePay dashboard indicators. Any company dashboard's total revenue is its core component. This KPI shows the capacity of InfinitePay to produce revenue over a certain time period and gives a broad overview of the company's financial health. Revenue monitoring on a regular basis helps stakeholders see patterns, evaluate growth, and decide on future tactics. The sales KPI deconstructs transactions in combination with total income, revealing the subtleties of product or service attractiveness. This measure offers detailed information that helps InfinitePay assess the performance of certain products and improve its sales tactics. It is possible to identify high-performing goods and services as well as potential problem areas by delving deeply into sales data...
What KPIs and Analytics Are Used on a Magazine Publisher's Dashboard? - For success, data-driven insights are now essential. Key Performance Indicators (KPIs) are used by magazine publishers, both conventional and digital, to track, evaluate, and improve their business operations. These KPIs provide useful information on numerous business factors, assisting publishers in making choices and adjusting to changing consumer tastes and market trends. The success of a magazine publisher depends critically on their ability to comprehend how consumers engage with the material. Metrics for measuring audience engagement include a variety of variables that reflect reader interest. Pageviews, time spent on page, bounce rate, and scroll depth are metrics that may be used to measure how engaging the content is and if the target audience finds it interesting. Citation counts are particularly valuable. Tracking metrics connected to subscriptions is crucial for publishers that provide subscription-based business models. Metrics like average revenue per user (ARPU), customer lifetime value (CLTV), and subscriber growth rate provide information on the health of the subscriber base and the total amount of income earned. These data aid in making tactical choices that will increase subscriber retention and draw in new ones...
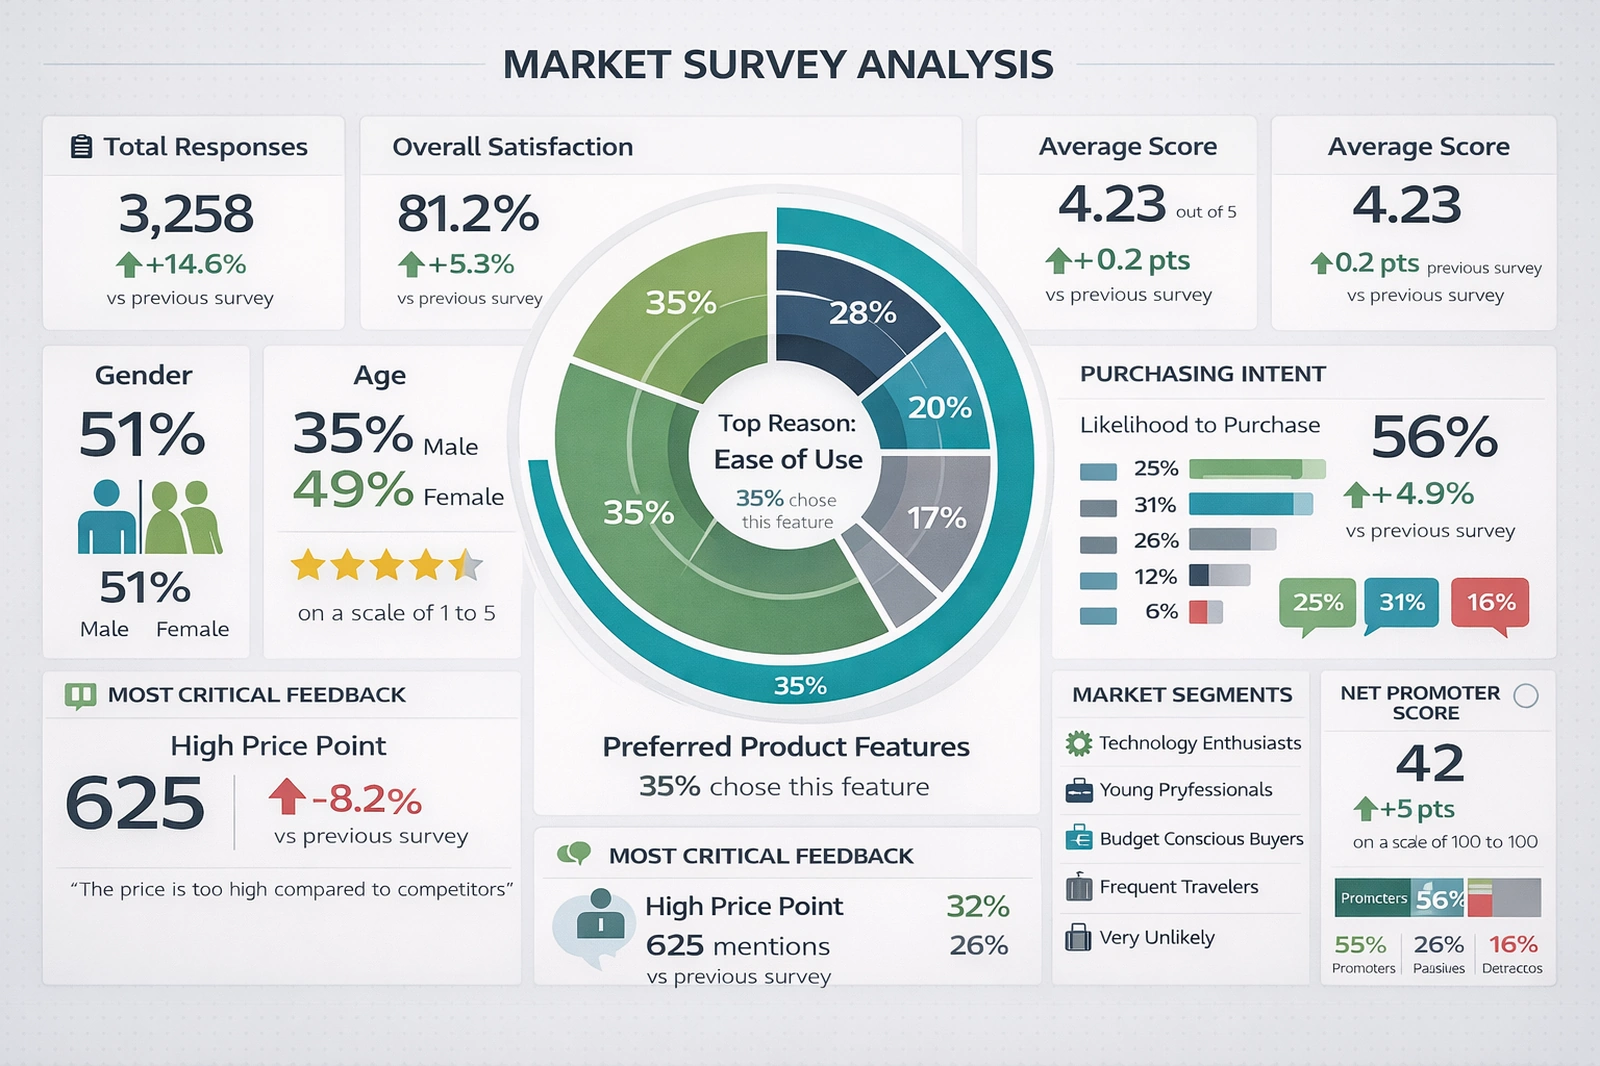
What KPIs and Analytics Are Used on NPS (Net Promoter Score) Dashboards? - Dashboards with the Net Promoter Score (NPS) have become essential tools for companies trying to measure customer loyalty and happiness. This article examines the KPIs and statistics that power NPS dashboards and their strategic decision-making insights. The Net Promoter Score, which measures customer loyalty, is the central component of NPS dashboards. determined with a simple query: "How likely are you to recommend our product or service to a friend or colleague?" NPS divides participants into three categories: Promoters, Passives, and Detractors. This provides a basis for in-depth examination. One of the most important KPIs is tracking the entire trend of NPS over time. With the help of this indicator, organizations may see patterns in customer satisfaction and pinpoint times when things are improving or becoming worse. Furthermore, setting benchmarks against industry norms gives firms perspective and helps them evaluate how they perform in comparison to their rivals...

What KPIs and Analytics Are Used on Real Estate Development Software Dashboards? - Real estate development software allows professionals to make data-driven choices thanks to technology. A crucial component of these software programs is the dashboard, which is a graphic depiction of important metrics and analytics that offers a thorough picture of the state of a project. We will examine the crucial analytics and Key Performance Indicators (KPIs) used in real estate development software dashboards in this article. Large sums of money are often needed for real estate development initiatives. For developers, monitoring the effectiveness of capital deployment is essential. This KPI evaluates how well money is used to advance the project, making sure that resources are distributed as efficiently as possible. A key financial indicator of a real estate project's success is return on investment, or ROI. Dashboard analytics in real estate development software determine return on investment (ROI) by weighing the project's profits against its expenses. Developers may assess the return on their investments with the help of this KPI...

What KPIs and Analytics Are Used on a Solar Power Generation Dashboard? - Solar energy has become a leader in renewable energy, offering a sustainable and environmentally beneficial way to meet our energy demands. As the solar business grows, it becomes more critical to monitor and optimize solar power production. An invaluable resource for this is a Solar Power Generation Dashboard, which provides information via an abundance of Key Performance Indicators (KPIs) and analytics. We explore the key performance and efficiency indicators of solar power systems in this article. The solar panels are the essential component of any solar power producing system. One important KPI that has a direct bearing on the system's overall performance is the efficiency of these panels. The ratio of the panels' energy output to their energy intake from sunlight is known as solar panel efficiency. Real-time data on each panel's efficiency are provided via a solar power generation dashboard, which helps operators quickly detect failing panels. Ensuring a good return on investment and maximizing energy output are made possible by this KPI...
What KPIs and Analytics Are Used on Subcontractor Software Dashboards? - Successful cooperation with subcontractors is essential for construction and project management. With its ability to streamline communication, project tracking, and general efficiency, subcontractor software has become a potent tool. Subcontractor software dashboards benefit from KPIs and analytics, which provide stakeholders meaningful information. In order to improve decision-making and project results, we explore the particular KPIs and analytics used on subcontractor software dashboards in this article. Timeline compliance is one of the main issues in building projects. KPIs pertaining to project progress and schedules are often included in subcontractor software dashboards. Metrics that provide project managers a thorough picture of how well the project is doing include task completion rates, milestone accomplishments, and deadline adherence. With real-time monitoring, any delays may be quickly identified and prompt interventions can be made to maintain the project on schedule...
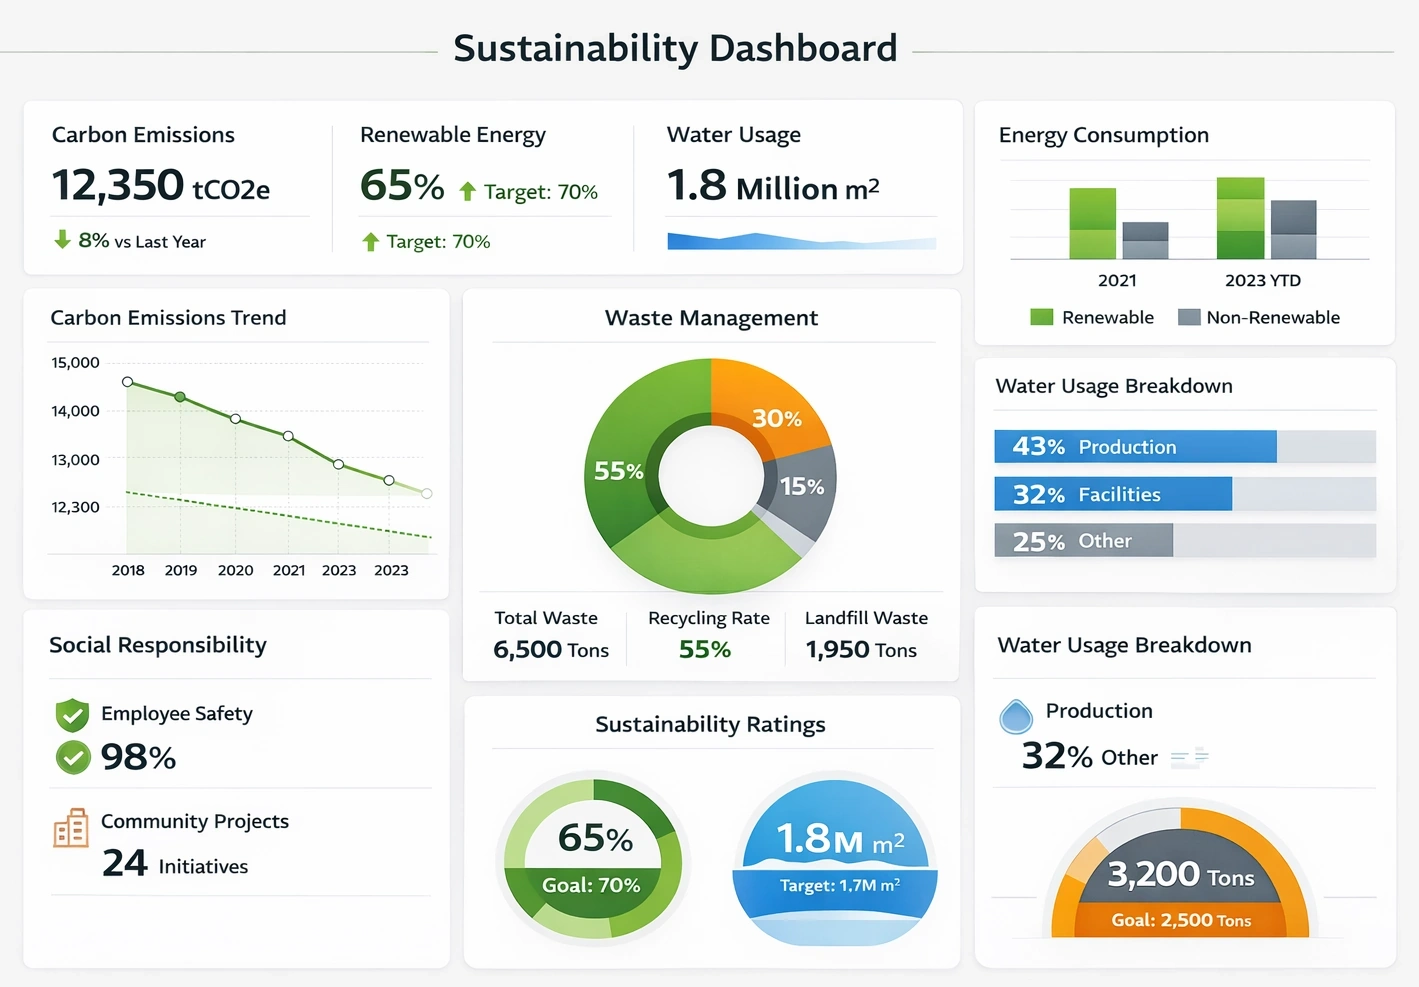
What KPIs and Analytics Are Used on Sustainability Software Dashboards? - Businesses navigating the complicated world of environmental, social, and governance (ESG) depend on sustainability software dashboards. These dashboards provide a thorough picture of a business's sustainability initiatives by using sophisticated analytics and Key Performance Indicators (KPIs). The main KPIs and metrics shown on these dashboards are examined in this article, which also clarifies their role in promoting a more sustainable future. A key performance indicator (KPI) for sustainability software dashboards is the carbon footprint of a business. The overall greenhouse gas emissions that are both directly and indirectly related to an organization's operations are measured by this KPI. Businesses may establish emission reduction objectives and find areas for improvement by using advanced analytics to help break down emissions by source...

What KPIs and Analytics Are Used on Emergency Management Dashboards? - Effective emergency management systems are essential in a world of natural catastrophes, pandemics, and unexpected events. Dashboards for emergency management are essential tools for keeping an eye on and efficiently handling a variety of disasters. These dashboards use KPIs and analytics to give a real-time snapshot of the situation for quick decision-making. We explore the KPIs and data found on emergency management dashboards in this article. Incident severity is one of the most important KPIs in emergency management. This KPI is essential for evaluating the seriousness of the problem and figuring out how much action is needed. There are certain measures for determining the intensity of different sorts of emergencies: Natural Disasters: Severity measures often take into account variables like wind speed, fire intensity, or Richter scale magnitude for natural catastrophes like hurricanes, earthquakes, or wildfires. These indicators aid in the proper allocation of resources and provide a clear picture of the possible effect. Pandemics: Key indices of severity for pandemics such as COVID-19 include the number of cases, hospitalization rates, and fatality rates. The trend of these figures aids in forecasting the burden on the healthcare system and the success of containment strategies. Humanitarian Crises: Measures such as food security indicators, violence indices, or displacement statistics may be used to determine the severity of humanitarian catastrophes, such as refugee crises or wars. Humanitarian groups might use this data to guide their plans for intervention and resource allocation...
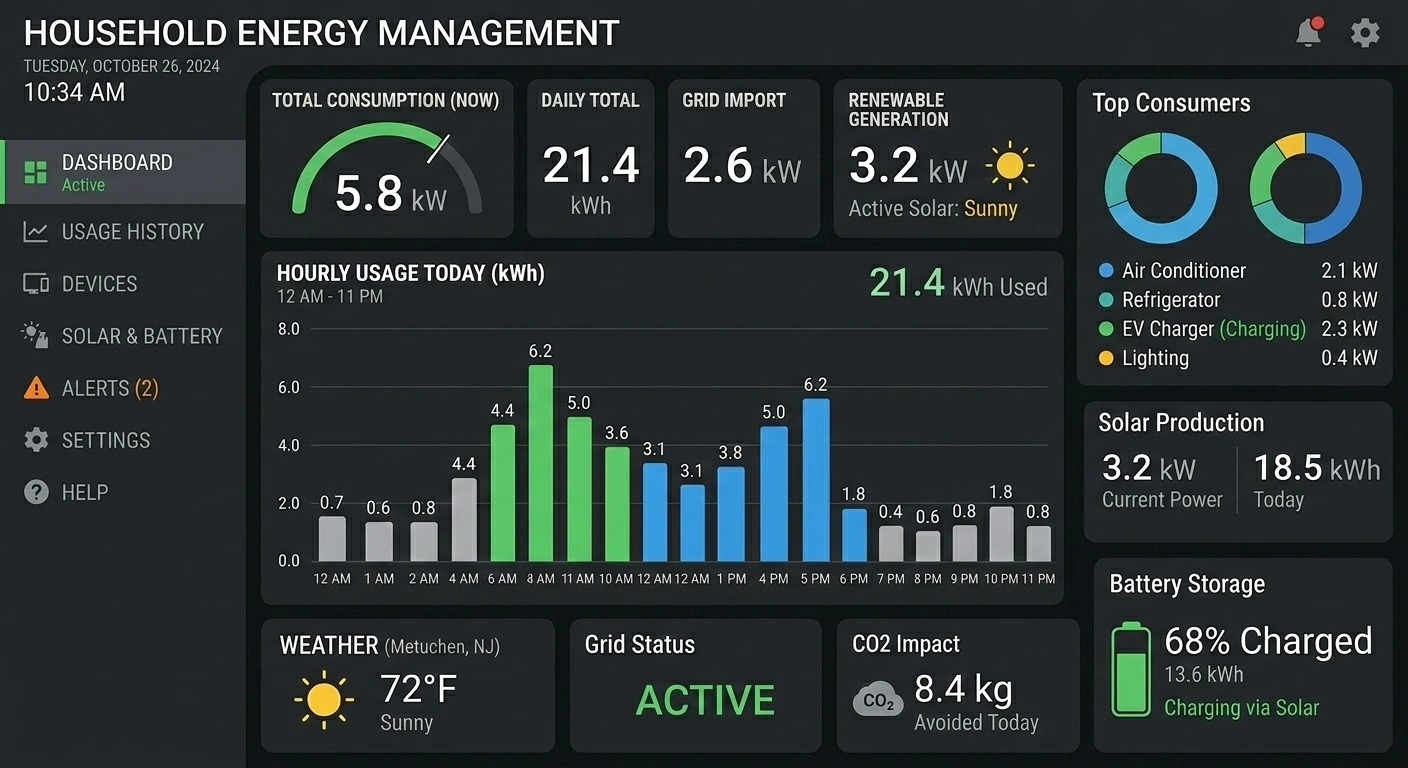
What KPIs and Analytics Are Used on Energy Management Dashboards? - Dashboards for energy management have become essential instruments for tracking and optimizing energy use. Energy use dashboards use KPIs and analytics to help organizations make educated choices and save energy. We will examine the important KPIs and metrics found on energy management dashboards in this post, as well as how they improve energy management. The foundation of energy management dashboards is energy consumption patterns. Stakeholders may recognize patterns and variations in energy use thanks to these trends, which provide a thorough picture of an organization's energy usage. Energy management dashboards help in forecasting and decision-making by displaying current and historical data. Organizations may identify abnormalities and take proactive measures to prevent energy waste by monitoring patterns in energy use. One of the most important KPIs for energy management dashboards is real-time energy usage. Because it offers a real-time feed of energy use, businesses can keep an eye on energy-intensive operations as they take place. Companies can react quickly to surges in energy use and put energy-saving measures into place in real time thanks to this real-time data. Additionally, it assists in locating equipment issues so that timely repairs may be made to avoid wasting energy...

What KPIs and Analytics Are Used on Heat Management Solution Dashboards? - Businesses are depending more and more on cutting edge technology to streamline their operations across a range of sectors. Heat management is a serious issue, particularly in sectors of the economy where temperature control is crucial. Solutions for managing heat have grown to be essential instruments for monitoring and managing temperature-related operations. These systems include advanced dashboards that provide analytics and insights in real time. The analytics and key performance indicators (KPIs) that are shown on dashboards for heat management solutions will be discussed in this article. It is essential to comprehend heat management solutions and their importance before diving into the KPIs and analytics. A variety of technologies and instruments are included in heat management systems, which are intended to monitor and control temperature in diverse processes and settings. They are used in fields where accurate temperature control is crucial, including as industry, energy, healthcare, and even data centers. These solutions are made up of sensors, controls, and often automated systems that cooperate to keep temperatures at ideal levels. Operators and engineers are then able to make educated choices by using dashboards to view the data produced by these components...
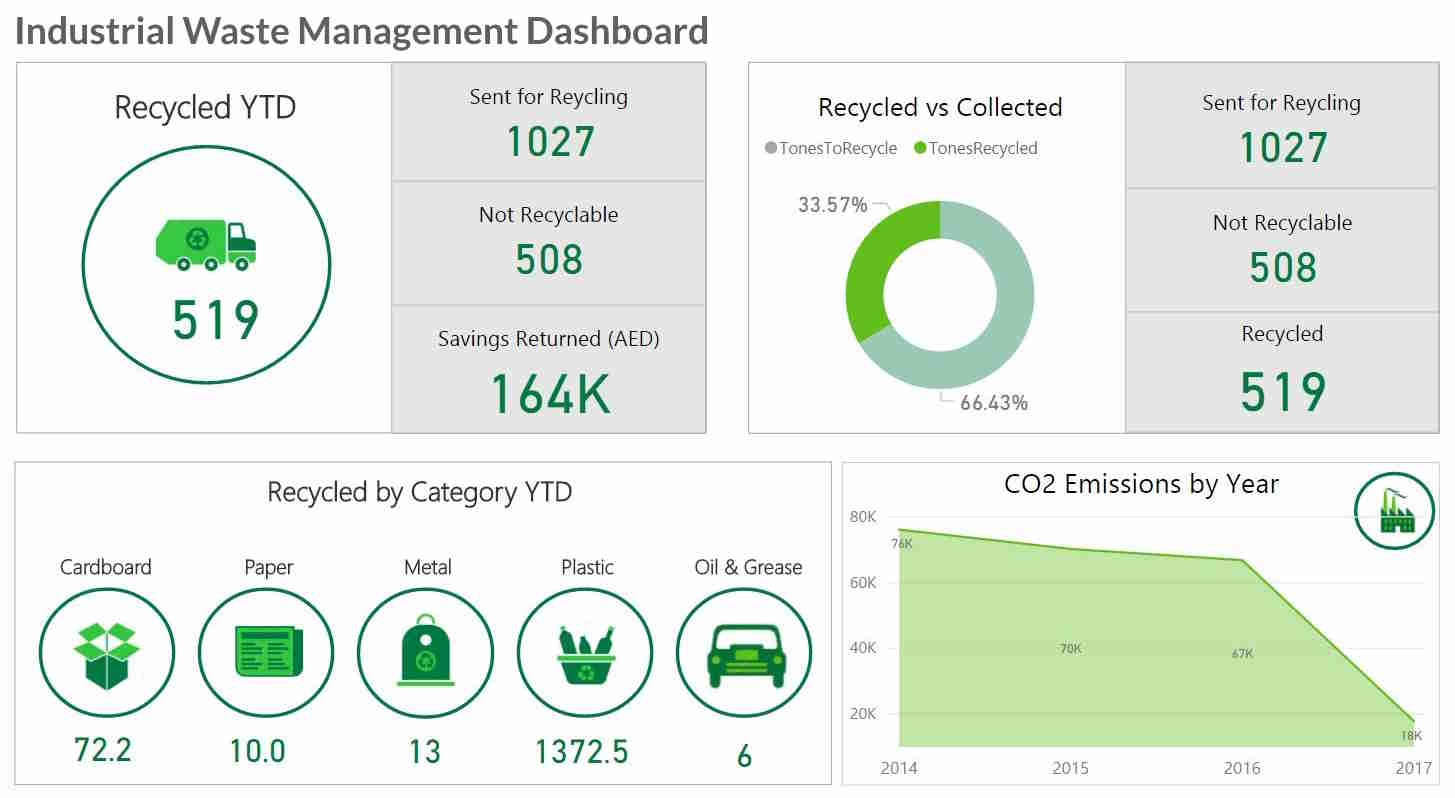
What KPIs and Analytics Are Used on Industrial Waste Dashboards? - Managing industrial waste is essential for maintaining environmental sustainability and adhering to regulations. Keeping an eye on and controlling industrial trash may be difficult because of the variety of waste that is produced and the requirement to adhere to strict environmental regulations. Industries use analytics and Key Performance Indicators (KPIs) on industrial waste dashboards to expedite this process. With the help of these instruments, waste management procedures may be enhanced, the environmental effect can be reduced, and compliance can be guaranteed. The many KPIs and metrics found on industrial waste dashboards, as well as their importance, will be discussed in this article. The trash production rate is a crucial key performance indicator that measures the quantity of garbage generated in a certain period of time. It facilitates resource allocation and trash reduction initiatives by assisting companies in understanding the scope of their waste output. Businesses may spot patterns, anomalies, and inefficiencies in their waste generating operations by monitoring this KPI...
What KPIs and Analytics Are Used on Mobile Carrier Messaging Network Dashboards? - Our connected world relies on mobile carrier messaging networks for text, multimedia, and other communications. Mobile carriers use KPIs and analytics to monitor, manage, and improve their messaging services as these networks grow more complicated and vital. The KPIs and analytics on mobile carrier messaging network dashboards help maintain the quality and efficiency of these critical communication networks. One of the most basic KPIs for mobile carrier messaging networks is the message delivery success rate. It calculates the proportion of communications that reach their intended recipients successfully. This KPI is crucial for evaluating the messaging service's overall dependability. A network's efficiency may be determined by its success rate; on the other hand, a low success rate might point to problems with message delivery or routing. The time it takes for a message to get from the sender to the receiver is measured by message latency. Because it directly affects user experience, it is a crucial KPI. Users may find it annoying when communications are delayed due to high latency. To make sure that messages are delivered on time, mobile carriers keep a careful eye on message latency...
What KPIs and Analytics Are Used on Ocean Freight Booking Platform Dashboards? - The transportation of commodities and products depends heavily on the maritime sector. In particular, maritime freight transportation is a vital link in the supply chain. Dashboards from ocean booking platforms are used by industry experts to improve and expedite the procedures involved in booking maritime freight. These dashboards provide well-informed decision-making by offering real-time insights on a variety of ocean freight logistics-related topics. These dashboards rely on KPIs and analytics to let stakeholders evaluate performance, analyze trends, and make data-driven decisions. This article explores the metrics and KPIs used on dashboards of ocean booking platforms and their importance in the shipping sector. Booking efficiency is one of the core KPIs of an ocean booking platform. This measure evaluates how efficiently and fast cargo can be scheduled on a ship. The time it takes to book cargo, the proportion of successful bookings, and the average time it takes to finish a booking are all revealed by the analytics in this field. By keeping an eye on these indicators, booking process bottlenecks may be found and corrected, increasing both customer happiness and efficiency...
What KPIs and Analytics Are Used on PEO Service Dashboards? - Professional Employer Organizations (PEOs) must use KPIs and analytics to provide efficient and effective services in a changing environment. PEO service dashboards act as the hub, offering data-driven decision-making and real-time insights. The article dissects the layers of data that propel success in this sector by examining the key KPIs and analytics used on PEO service dashboards. PEO operations revolve on the primary duty of accurately handling payroll and guaranteeing adherence to constantly changing rules. This category's key performance indicators include payroll processing timeliness, tax compliance, and mistake rates. By exposing trends via analytics, PEOs may improve overall accuracy and deal with inconsistencies proactively, which paves the way for customer satisfaction and regulatory compliance...
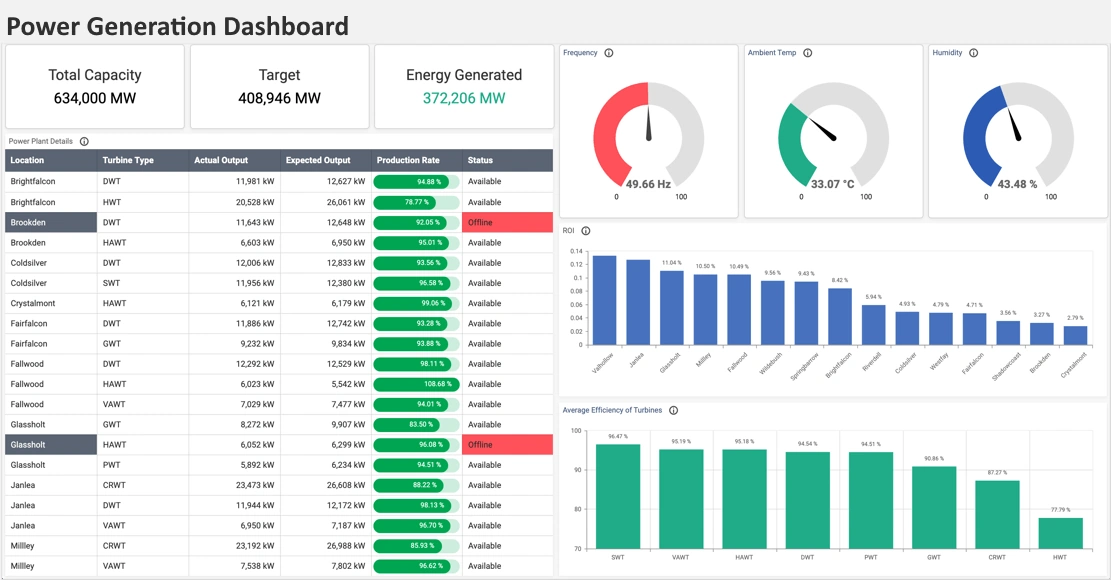
What KPIs and Analytics Are Used on Power Generation Dashboards? - Ensuring dependable and effective energy generation is crucial. To monitor and manage their operations, power production businesses and utility providers use a variety of key performance indicators (KPIs) and analytics. Power generating dashboards, which provide a thorough and up-to-date picture of the whole power production process, are essential to this effort. This article examines the statistics and KPIs that are often shown on dashboards for power generating and discusses their importance in the energy industry. One essential KPI in the production of electricity is capacity utilization. It gauges how well a power plant uses its available production capacity. Real-time capacity utilization percentages are often shown on a power generating dashboard, which helps operators determine if the plant is running as efficiently as possible. For the purpose of maximizing resource allocation, minimizing downtime, and guaranteeing cost-effective operations, capacity utilization monitoring is essential...
What KPIs and Analytics Are Used on Practice Management Dashboards? - The healthcare, legal, financial, and other service industries rely on practice management dashboards. By using analytics and key performance indicators (KPIs), these dashboards are intended to provide a thorough picture of a dental, mental health, or family practice performance. This article will discuss practice management dashboards and the KPIs and statistics that improve patient satisfaction, billing efficiency, profits, decision-making, and success. Prioritizing patient or customer pleasure is crucial in the legal, healthcare, and other service sectors. KPIs and data pertaining to customer happiness, such as Net Promoter Score (NPS) and Customer happiness Score (CSAT), are often included in practice management dashboards. NPS assesses patients' or customers' propensity to refer the service to others, while CSAT evaluates their level of satisfaction with the whole encounter. By examining these data, one may get insight into areas that need improvement and raise the standard of service. In the healthcare industry, like in other service industries, effective scheduling and appointment management are essential. KPIs including provider utilization, appointment no-show rates, and scheduling accuracy are often tracked using dashboards. By preventing any slots from being underutilized and cutting down on patient wait times, these measures aid in the optimization of appointment scheduling...
What KPIs and Analytics Are Used on Rental Property Management Dashboards? - In order to optimize profits and simplify operations, property managers are depending more and more on advanced tools and technology. These solutions, including rental property management dashboards, provide a single hub for property performance monitoring. This article discusses how rental property management dashboard KPIs and analytics help property managers make educated choices and improve efficiency. The occupancy rate is one of the core KPIs shown on rental property management dashboards. This measure gives an overview of the proportion of leased apartments to all available units. In order to assess the performance of their real estate assets, property managers keep a careful eye on occupancy rates. A low occupancy rate may suggest poor marketing or property management, whereas a high rate shows significant demand. To maximize occupancy and income, property managers may monitor this KPI and alter price, marketing, and tenant retention...
What KPIs and Analytics Are Used on Requirements Management Dashboards? - Good requirements management is essential to making sure a project or product is delivered successfully. Managing requirements entails acquiring, documenting, and verifying requirements, monitoring changes, and ensuring they meet project goals. This is where requirements management dashboards may assist teams obtain insights, make educated choices, and enhance software or project quality. This article discusses requirements management dashboard KPIs and analytics and their role in the software development lifecycle. A good requirements management method is predicated on effective requirement traceability. It is keeping track of and recording the connections between different needs in order to make sure that every demand can be linked to its original sourceâ€"a business need or stakeholder request, for example. Key KPIs and Analytics: Traceability Matrix Completion Rate: The proportion of needs that have been successfully tracked down to their original sources is measured by this KPI. A greater percentage of completion signifies a stronger traceability, lowering the possibility of criteria being overlooked. Cross-Requirement Impact Analysis: analytics that highlight the effects and interdependencies among requirements. Comprehending these associations facilitates the evaluation of possible impacts of modifications on other prerequisites, hence enhancing change management...
What KPIs and Analytics Are Used on Revenue Cycle Management Dashboards? A critical component of maintaining the financial stability of healthcare businesses is revenue cycle management, or RCM. Organizations use complicated dashboards with analytics and Key Performance Indicators (KPIs) to effectively manage the intricacies of revenue cycles. These resources provide priceless insights into the organization's financial health and support decision-making by stakeholders. This article examines Revenue Cycle Management dashboard KPIs and analytics and their use in financial process optimization. Days in Accounts Receivable (DAR) is one of the cores KPIs in dashboards for revenue cycle management. The average number of days it takes a healthcare company to be paid after rendering services is measured by this KPI. A lower DAR suggests that the company is collecting payments on time and has a more effective revenue cycle. If DAR is high, billing and collections concerns may be present, requiring firms to explore and fix inefficiencies to improve cash flow...
What KPIs and Analytics Are Used on Sales Coverage Analysis Dashboards? - Sustainable development requires that your sales coverage be understood and optimized. Insights into the productivityy and efficiency of your sales activities are provided by sales coverage analysis dashboards, which are necessary tools to lead a high-performance sales team.. These dashboards provide you a thorough overview of your sales coverage via the use of analytics and key performance indicators (KPIs). This article discusses sales coverage analysis dashboards' key KPIs and analytics, revealing how they help companies increase sales and revenue. Tracking the sales pipeline is one of the core elements of a dashboard for sales coverage analysis. This KPI offers a quick overview of the several phases a lead or prospect experiences prior to becoming a client. Among the metrics used in this category are: Conversion Rates: The proportion of leads that advance from one step of the sales funnel to the next is tracked by conversion rates. A well-optimized sales process is indicated by a better conversion rate. Sales Velocity: The pace at which leads pass through the pipeline is measured by sales velocity. It takes transaction closing time into account, which improves revenue forecasting for businesses. Deal Size: Knowledge of deal sizes at various stages of the pipeline can lead to new sources of income. It aids in giving high-value opportunities priority...
What KPIs and Analytics Are Used on Shared Rider System Dashboards? - Data-driven insights play a critical role in the effective administration of shared rider systems. These systems' dashboards act as command centers, providing a thorough view of analytics and key performance indicators (KPIs). This article explores the key performance indicators that make up these dashboards, illuminating how they improve user experience and operational efficiency. The percentage of rides completed is one of the main KPIs tracked on dashboards for shared rider systems. The proportion of started rides that are successfully finished is assessed by this measure. Reliability of the transportation network, smooth user experiences, and operational efficiency are all indicated by a high completion rate. On the other hand, a falling completion rate might indicate problems with the app, driver availability, or route optimization, which would need quick fixes...
What KPIs and Analytics Are Used on Waste Collection Software Dashboards? - Businesses are using technology to improve productivity and simplify processes. This change has also been welcomed by waste management, an essential component of urban infrastructure, via the use of advanced waste collection software (WCS). These systems not only help with improved administration, but they also provide insightful data via analytics and Key Performance Indicators (KPIs). We explore the key KPIs and statistics found on waste collection software dashboards in this article, providing insight into how these measurements support efficient trash management. Optimizing collection routes to decrease fuel consumption, vehicle wear and tear, and ultimately reduce costs is one of the main difficulties in garbage management. Dashboards for waste collection software use a range of KPIs and data to optimize routes: garbage management teams may locate hotspots with the use of collection density heatmaps, which show the concentration of garbage in certain places. Managers may make route optimizations to guarantee effective garbage collection in high-density areas by examining these heatmaps...

What KPIs and Analytics Are Used on a Water Treatment Plant Dashboard? - In order to guarantee that populations get clean, safe water, water treatment facilities are essential. These facilities use analytics and key performance indicators (KPIs) on their dashboards to monitor, optimize, and enhance their operations as technology develops. This article discusses water treatment plant dashboard KPIs and analytics, highlighting efficiency and reliability tools. A collection of KPIs for tracking water quality are the fundamental components of any dashboard in a water treatment facility. To make sure the water satisfies regulatory requirements, parameters including turbidity, pH levels, dissolved oxygen, and chemical concentrations are essential. Plant operators can quickly spot abnormalities and take remedial action to ensure water quality when these parameters are monitored in real-time. KPIs pertaining to treatment efficiency provide valuable information about the efficacy of the plant's water purification process. Measures including organic matter, virus, and bacterium clearance rates are used to assess how well the treatment methods are working. Analyzing treatment efficiency KPIs helps to make water treatment operations more economical and sustainable by maximizing resource use and reducing waste...
What KPIs and Analytics Are Used on a Worker Safety Dashboard? - Organizations are depending more and more on cutting-edge instruments and technology in the field of occupational health and safety in order to track and enhance worker safety. The Worker Safety Dashboard, a centralized center that offers real-time insights into numerous areas of workplace safety, is one such product that is becoming more and more popular. Analytics and Key Performance Indicators (KPIs) are essential to the effectiveness of these dashboards. Let's examine the particular KPIs and statistics that these dashboards utilize to promote workplace safety. Total Incident Rate (TIR): This KPI determines the overall number of occurrences per 100 workers over a certain period of time. It is a basic indicator that gives an overview of a workplace's overall performance in terms of safety. Severity Rate: It's critical to evaluate the occurrences' seriousness. The number of days missed as a result of work-related events per 100 full-time workers is measured by the severity rate KPI. This aids businesses in comprehending how occurrences affect the wellbeing and productivity of their personnel...
What KPIs and Analytics Do Airline Operations Professionals Use? - Even the smallest inefficiency or delay may have serious repercussions in the highly competitive and sophisticated aviation business. As a result, experts in airline operations are always searching for methods to streamline their processes and raise their performance. Professionals in airline operations employ key performance indicators (KPIs) and analytics as crucial tools to accomplish these objectives. We will examine the KPIs and analytics used by airline operations specialists to manage their operations in this post. One of the most important KPIs for airlines is OTP. It calculates the proportion of flights that reach their destination on schedule. OTP is a critical component of customer satisfaction and is used by airlines as a gauge of their performance and dependability. An airline that continuously has a high OTP is more likely to draw in new passengers and keep up a good reputation...
What KPIs and Analytics Do Data Operations Professionals Use? - The efficient, precise, and secure processing of data is the responsibility of data operations specialists. They oversee data analysis, storage, warehousing, and pipelines. Data operations experts employ key performance indicators (KPIs) and analytics to assess the effectiveness of their operations and make wise choices. We will examine the most popular KPIs and analytics utilized by data operations experts in this post. Data consistency, reliability, and error-freeness are gauged by data correctness. Inaccurate data may result in inaccurate conclusions and judgments, which can have serious repercussions for a company. Data correctness may be measured by data operations experts using KPIs like data error rates, data completeness, and data consistency...
What KPIs and Analytics Do FinOps Analysts Use? - The importance of the FinOps (Financial Operations) professional has grown as firms continue to reap the advantages of cloud computing. These people are in charge of overseeing the financial elements of cloud operations, such as budgeting, cost allocation, and cost optimization. Key performance indicators (KPIs) and analytics are used by FinOps professionals to measure and evaluate their organization's cloud expenditures. We will examine some of the KPIs and metrics that FinOps professionals utilize most often in this post. Making ensuring that their organization's cloud expenditure is optimized to get the most value for the money invested is one of the main duties of FinOps professionals. They depend on KPIs and analytics to analyze expenditure patterns and pinpoint places where expenses may be cut in order to do this...
What KPIs and Analytics Do Project Analysts Use? - Understanding key performance indicators (KPIs) and analytics as a project analyst is crucial to making sure a project is successful. Project analysts may use these indicators to monitor progress, spot possible problems, and reach data-driven conclusions. We'll look at some of the most popular KPIs and analytics in project management in this post. The effort required to get the intended result is referred to as the project's scope. Project analysts may gauge a project's advancement in relation to its initial scope with the use of project scope KPIs. The most typical scope KPIs are as follows: Scope Creep: Any unauthorized additions or modifications to the project scope are referred to as scope creep. Monitoring changes in the project's scope over time will allow project analysts to assess scope creep...

What KPIs and Analytics Do Vendor Analysts Use? - Vendor analysts are experts who focus on assessing the goods and services provided by vendors in a certain market. Their objective is to provide companies information about these suppliers' performance so they can make wise investments in the goods and services they need. Vendor analysts employ key performance indicators (KPIs) and analytics as crucial tools to do this. We will examine the KPIs and analytics used by vendor analysts to evaluate the performance of vendors in this post. Competitive Analytics: Analyzing competitor data to understand their advantages and disadvantages, positioning in the market, and pricing tactics is known as competitive analytics. Competitive analytics are used by vendor analysts to assess how well vendors are doing in comparison to their rivals and to spot possibilities to achieve a competitive edge...
What KPIs and Analytics Do Security Intelligence Analysts Analysts Use? - Security concerns have grown significantly for companies of all sizes. Nowadays, businesses spend money on effective security measures to safeguard their systems, networks, and data. They must have a thorough awareness of their security posture and dangers in order to do this. Security intelligence analysts can help in this situation. These experts are in charge of collecting, analyzing, and interpreting data to spot possible risks and weaknesses. They achieve this by using a variety of statistics and key performance indicators (KPIs). In this post, we'll examine in more detail the KPIs and analytics that security intelligence analysts use to safeguard the information assets of their organizations. The accuracy of their threat intelligence is one of the major KPIs for security intelligence analysts. This entails calculating the proportion of notifications that are reliable and suitable for action. High levels of precision show that the team is successfully identifying and addressing serious dangers. On the other side, low accuracy levels can mean that the team is spending time and money looking for false positives...

What KPIs and Analytics Does an Accounting Analyst Use? - Accounting gives decision-makers vital information about a company's financial situation, assisting them in making wise decisions. The use of Key Performance Indicators (KPIs) and analytics to assess and track financial performance is a crucial component of contemporary accounting. To evaluate the success of financial plans and identify opportunities for development, accounting analysts depend on these measurements. This article will examine the essential KPIs and analytics used by accounting analysts to fuel corporate performance. The ultimate objective of every firm is profitability. To evaluate a company's capacity to produce profits in relation to its revenue, assets, or equity, accounting analysts utilize a variety of profitability measures. Some typical profitability ratios are: Gross Profit Margin: The revenue-to-cost ratio calculates the proportion of sales that surpasses the cost of items supplied. Higher values imply better cost management and pricing strategies. It shows how well a firm produces and sells its goods. Net Profit Margin: The net profit margin, as opposed to the gross profit margin, takes into account all operational costs, such as taxes and interest. It displays the portion of income that is still profit after all costs have been paid...
What KPIs and Analytics Does a Budget Analyst Use? - The effective allocation and management of resources is ensured through budgeting. A budget analyst is in charge of creating, analyzing, and maintaining an organization's financial budget. Budget analysts use a variety of Key Performance Indicators (KPIs) and analytics to monitor financial performance, spot patterns, and reach informed judgments in order to efficiently carry out their responsibilities. This article covers the important KPIs and analytics that budget analysts often use to successfully negotiate the challenging realm of budgeting. A crucial KPI called budget compliance rate gauges how closely actual spending follows planned spending. Budget analysts may evaluate an organization's financial discipline and efficiency by comparing actual expenditure to the projected budget. A low rate may indicate overspending or insufficient planning, while a high rate implies efficient budgeting and expenditure management. Budget analysts utilize variance analysis as a crucial analytical technique to investigate discrepancies between planned and actual financial data. Organizations are able to modify their financial strategy as a result of this study, which aids in determining the causes of differences. Positive variations (actuals that exceed budgets) may highlight opportunities for cost savings or revenue development, while negative deviations may point to inefficiencies that need to be addressed right now...
What KPIs and Analytics Does a Customer Experience Operations Analyst Use? - Providing outstanding customer experience has become an important difference in today's fiercely competitive corporate environment. Companies use customer experience operations analysts, who are critical in gauging and enhancing customer happiness, to do this. To acquire insights into consumer behavior, pinpoint problem areas, and enhance the overall customer experience, these analysts use a variety of key performance indicators (KPIs) and analytics. The important KPIs and data that customer experience operations analysts utilize to fuel company performance will be discussed in this article. The Net Promoter Score (NPS) is one of the key KPIs used by customer experience operations analysts. By calculating the chance that consumers would refer a brand's goods or services to others, NPS calculates customer loyalty. Analysts gather data to compute NPS using surveys and other feedback channels, allowing them to evaluate consumer happiness and spot brand supporters or detractors. Analysts may make strategic judgments based on the effect of their actions on customer loyalty by tracking NPS over time...
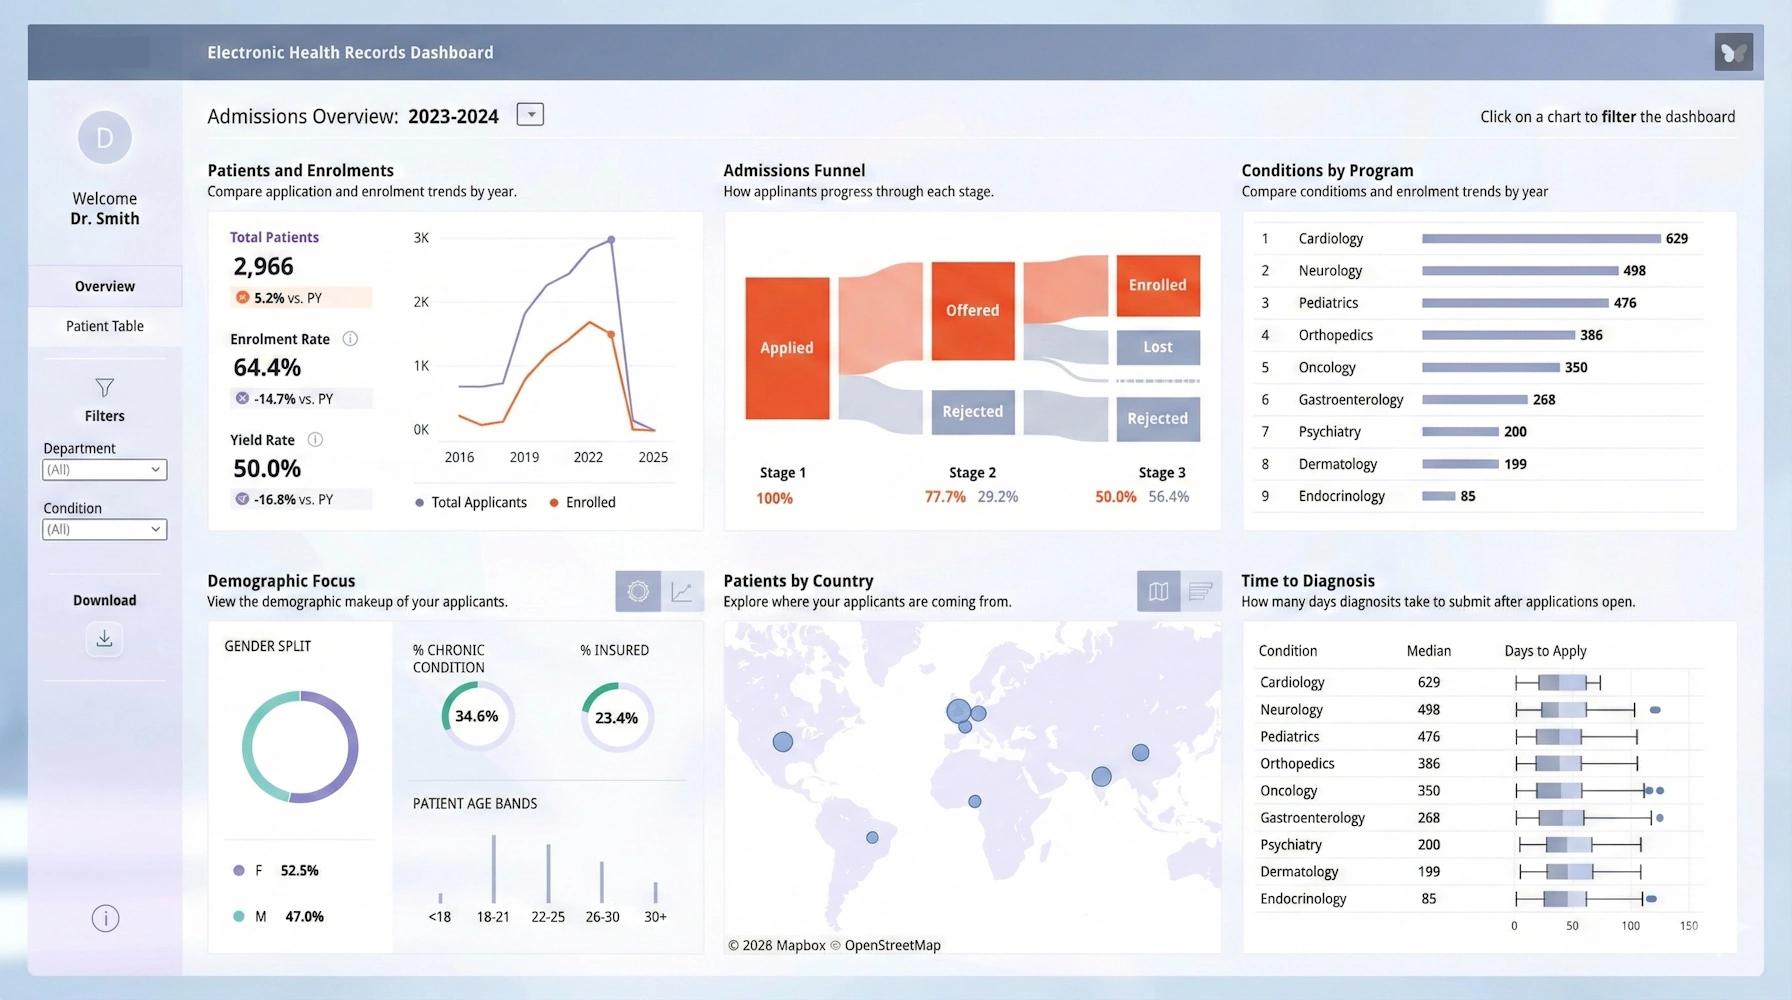
What KPIs and Analytics Does an EHR Analyst Use? - EHR (Electronic Health Record) technologies have revolutionized how patient data is maintained, saved, and analyzed in contemporary healthcare. The need for an EHR analyst is growing as the healthcare sector continues to depend extensively on technology. EHR analysts are in charge of maintaining and improving electronic health record systems to make sure they satisfy the requirements of both patients and healthcare providers. We are going to look at the key performance indicators (KPIs) and analytics used by EHR analysts to assure the effective operation of EHR systems in this article. Understanding the function of EHR analysts within the healthcare ecosystem is essential before diving into the particular KPIs and analytics they use. EHR analysts are highly qualified individuals who straddle the line between technology and operational healthcare. In order to manage, enhance, and optimize EHR systems, they collaborate closely with IT teams, healthcare providers, and other stakeholders. System uptime, which calculates the proportion of time the EHR system is completely functional, is one of the most important KPIs for EHR analysts. Downtime may cause patient care to be disrupted, which can have serious repercussions. To guarantee constant access to patient information, EHR analysts keep an eye on uptime and work to enhance it...
What KPIs and Analytics Does a Mining Production Analyst Use? - Effective production management is essential to maximizing output, reducing costs, and ensuring safety in the dynamic and complicated world of mining. Key performance indicators (KPIs) and advanced analytics are used by mining production analysts to evaluate operational efficiency and identify areas for improvement. The following article will focus on the important KPIs and analytics utilized by production analysts in the mining industry, illuminating their relevance in streamlining mining operations. It's important to understand what a mining production analyst is responsible for before getting into the details. These experts are in charge of compiling, deciphering, and interpreting enormous volumes of data pertaining to mining operations. Their main objective is to support data-driven decision-making and provide insights to improve operational performance, resource allocation, and production processes. KPIs are quantitative measurements used to evaluate the effectiveness of different mining operations components. Mining production analysts use a variety of KPIs to gauge operational effectiveness and track progress toward corporate goals. Among the most significant KPIs are...
What KPIs and Analytics Does a Risk Operations Analyst Use? - In order to guarantee operational effectiveness and protect a company's reputation, risk management has become a critical component. Analysts of risk operations are essential in locating, evaluating, and minimizing possible hazards. They use a variety of key performance indicators (KPIs) and analytics to track and gauge the success of their risk management initiatives in order to achieve this. In this article, we'll look at important KPIs and analytics that a risk operations analyst uses to make sure that risk management is done effectively. The risk operations team's reaction time to recognized risks or possible threats is gauged by incident response time. It shows how well the team's risk reduction procedures work. A quicker reaction time is often preferable since it reduces the possible effect of hazards and shows the team's capacity for quick crisis management. This KPI evaluates how well the risk operations analyst can identify possible risks and hazards. A high-risk detection rate demonstrates a sharp eye for seeing new problems, enabling the team to handle them before they become major difficulties...
What KPIs and Analytics Does an Inventory Operations Analyst Use? - Achieving organizational objectives and streamlining processes depend heavily on effective inventory management. Key actors in this process are inventory operations analysts who use analytics and key performance indicators (KPIs) to track and enhance inventory performance. We will examine the crucial KPIs and analytics used by inventory operations analysts to guarantee effective inventory management in this article. Inventory operations analysts utilize inventory turnover as a key KPI to gauge how rapidly stock is sold and replaced over the course of a certain time frame. It is derived by dividing the average inventory value by the cost of goods sold (COGS). A high turnover rate suggests effective inventory control since it suggests that goods are moving quickly through the supply chain. In contrast, a low turnover rate can be an indication of too much inventory, which would tie up funds and increase the risk of obsolescence or holding expenses...
What KPIs and Analytics Does an Investment Operations Analyst Use? - Investment operations analysts are essential to the financial sector because they make sure that investment operations run smoothly and effectively. These experts depend on analytics and key performance indicators (KPIs) to oversee and improve investment processes. We will examine the crucial KPIs and analytics utilized by investment operations analysts in this post, emphasizing their importance and showing how they affect decision-making and performance assessment. The following KPIs and metrics are constantly monitored by investment operations analysts since efficient trade execution is essential to these activities: Trade Execution Speed: The time it takes to execute transactions is measured by this KPI. Analysts monitor the amount of time that passes between placing an order and the transaction being completed, striving for quick execution to take advantage of market opportunities and reduce exposure to market hazards. Fill Rate: The proportion of orders that are successfully performed is shown by the fill rate KPI. To evaluate the effectiveness of trade execution, spot any order routing or trade settlement concerns, and modify the procedure for better performance, analysts look at the fill rate. Trading Costs: For investment operations analysts, keeping an eye on trading expenses is essential. Analysts may find possibilities for cost savings, improve terms with brokers, and improve overall trade execution efficiency by evaluating transaction fees, bid-ask spreads, and other costs...
What KPIs and Analytics Does a Logistics Operations Analyst Use? - Logistics is essential to guaranteeing effective transportation of products and services in today's complex and competitive corporate environment. Logistics organizations depend on the knowledge of logistics operations analysts to improve operations and make data-driven choices. These experts use analytics and key performance indicators (KPIs) to evaluate performance, pinpoint problem areas, and promote operational excellence. We will examine the essential KPIs and statistics utilized by logistics operations analysts in this article, emphasizing their importance in improving logistics efficiency. In the logistics sector, on-time delivery is a crucial KPI for assessing a company's capacity to complete deliveries within the specified window of time. On-time delivery performance is continuously monitored and examined by logistics operations experts to identify bottlenecks and possible supply chain interruptions. By monitoring this KPI, analysts may identify particular areas that need improvement, such as improving stakeholder collaboration or streamlining transportation routes...

What KPIs and Analytics Does a Manufacturing Operations Analyst Use? - Businesses in the manufacturing industry work to increase productivity, lower costs, and improve operational efficiency. Manufacturing operations analysts are crucial in achieving these objectives by using analytics and key performance indicators (KPIs). The key KPIs and analytics that factory operations analysts use to promote operational success and continuous improvement are examined in this article. The Overall Equipment Effectiveness indicator assesses both the effectiveness of the production process and the performance of industrial equipment. It has three crucial elements: Availability: This KPI evaluates equipment uptime by calculating the proportion of time it is accessible for production. Availability may be impacted by downtime brought on by repairs, malfunctions, or transitions. Performance: The speed at which equipment functions in relation to its optimum capacity is measured by the performance KPI. It assesses variables such as cycle duration, output rate, and equipment dependability. Quality: The rate of production from manufacturing equipment that is free of defects is the focus of the quality KPI. It keeps track of the proportion of goods that fulfill quality requirements...
What KPIs and Analytics Does a Procurement Operations Analyst Use? - Organizations are realizing more and more how important procurement operations are for reducing costs, preserving relationships with suppliers, and streamlining supply chain operations. Businesses depend on procurement operations analysts to guarantee that procurement activities are operating at peak efficiency. These experts evaluate and enhance the efficacy and efficiency of procurement processes using analytics and Key Performance Indicators (KPIs). In this article, we'll examine the important KPIs and analytics used by procurement operations analysts to strengthen procurement procedures and advance larger corporate goals. Cost reduction and cost avoidance are two of the main goals of procurement operations. The term "cost savings" describes the decrease in procurement expenses achieved via bargaining, strategic sourcing, and supplier management. The goal of cost avoidance, on the other hand, is to reduce wasteful spending via rigorous contract management and supplier selection. These variables are tracked and analyzed by procurement operations analysts to make sure that procurement activities support cost-cutting objectives and directly impact the organization's bottom line...
What KPIs and Analytics Does a Product Support Analyst Use? - Businesses depend on data-driven insights for product development and customer centricity to make wise choices. The Product Support Analyst (PSA) is one of the important participants in this process. These experts are in charge of making sure that goods live up to client expectations and fixing any potential problems. PSAs use a variety of Key Performance Indicators (KPIs) and analytics to accomplish these objectives. The following article will discuss the KPIs and analytics a Product Support Analyst uses to improve product performance, customer happiness, and company success. The function of a Product Support Analyst must be understood before diving into the KPIs and analytics. PSAs are essential to the stage of a product's life cycle after launch. They serve as a link between stakeholders, product development teams, and consumers. Their main duties are as follows...
What KPIs and Analytics Does a Project Operations Analyst Use? - The use of data-driven decision-making is important for effective project management. Through the use of different analytics tools and the monitoring of key performance indicators (KPIs), project operations analysts play a critical role in ensuring that projects function successfully. This article examines the top KPIs and analytics that project operations analysts use to boost productivity and provide effective results. The success of a project depends on meeting deadlines and completing milestones on time. Analysts that specialize in project operations monitor deadlines to make sure that activities are being completed as expected and to spot any possible bottlenecks. Finding areas of resource waste or scarcity is made easier by analyzing resource allocation and use. Project operations analysts can maximize resource allocation with the help of this KPI. To prevent cost overruns, it is important to track project spending against the allocated budget. Analysts may make wise choices to manage expenditure and preserve financial health by monitoring this KPI...
What KPIs and Charts Are Used on Hospice Management Dashboards? - Providing patients and their families with compassionate end-of-life care is the delicate and complex work of hospice administration. Key Performance Indicators (KPIs) and charts are essential tools for tracking, assessing, and improving care quality in this setting. Hospice care managers may make well-informed choices and maximize their services by using the visual depiction of vital data that hospice management dashboards provide. Now let's examine the key KPIs and charts included in dashboards for hospice management. A key performance indicator (KPI) in hospice management dashboards is the number of patient admissions and duration of stay. This measure sheds light on how quickly patients are admitted to hospice care and how long they stay there on average. Administrators can spot trends, evaluate how resources are allocated, and guarantee that patients get the right kind of care the whole time they are there by monitoring these KPIs. One possible graphic that goes along with this KPI would be a trendline that shows the monthly or quarterly variations inpatient admissions. The distribution of duration of stay might be shown in a different bar chart, which would help identify any outliers or potential improvement areas. Hospice managers may tailor their facilities to accommodate changing patient needs and facilitate a smooth transition for patients joining and leaving the program by concentrating on these criteria...
What KPIs Are Used on Media Coverage Analysis Dashboards? - Dashboards for coverage analysis are essential for determining how well a company's tactics are connecting with the target market. They provide a thorough review of key performance indicators (KPIs) that assess the success of advertising campaigns, marketing initiatives, and communication plans. In this article, we'll examine the crucial KPIs used on dashboards for coverage analysis and examine how they help with strategic planning and informed decision-making. Fundamental metrics for evaluating a campaign's early exposure include reach and impressions. While impressions represent the overall number of times the material has been shown, reach describes the specific number of people who have seen it. These indicators provide light on the campaign's general exposure and possible influence. The monetary value of the media attention a firm has gotten is measured by its media value. It figures out what the business would have paid if it had bought the same quantity of advertising space. For calculating the ROI of earned media and comprehending the financial effects of media coverage, this KPI is essential...
What KPIs Do Sales Operations Analysts Use? - Key performance indicators (KPIs), trends, and sales data are measured and analyzed by sales operations analysts. They are essential in fostering corporate development by offering perceptions and suggestions that boost sales results. We will examine the KPIs and analytics used by sales operations analysts to assist companies in achieving their sales objectives in this post. Any firm that depends on sales must have sales operations. It serves as the foundation of the sales department and is in charge of making sure all operations linked to sales function smoothly. Sales operations include a wide range of tasks, including controlling the sales funnel, predicting sales, controlling territories and quotas, as well as collecting data and offering insights into sales performance. Sales data must be gathered and examined by sales operations analysts in order to spot patterns and areas for development. They collaborate closely with sales executives to create plans and programs that boost sales. Their work enables companies to make choices that optimize profits and revenue...
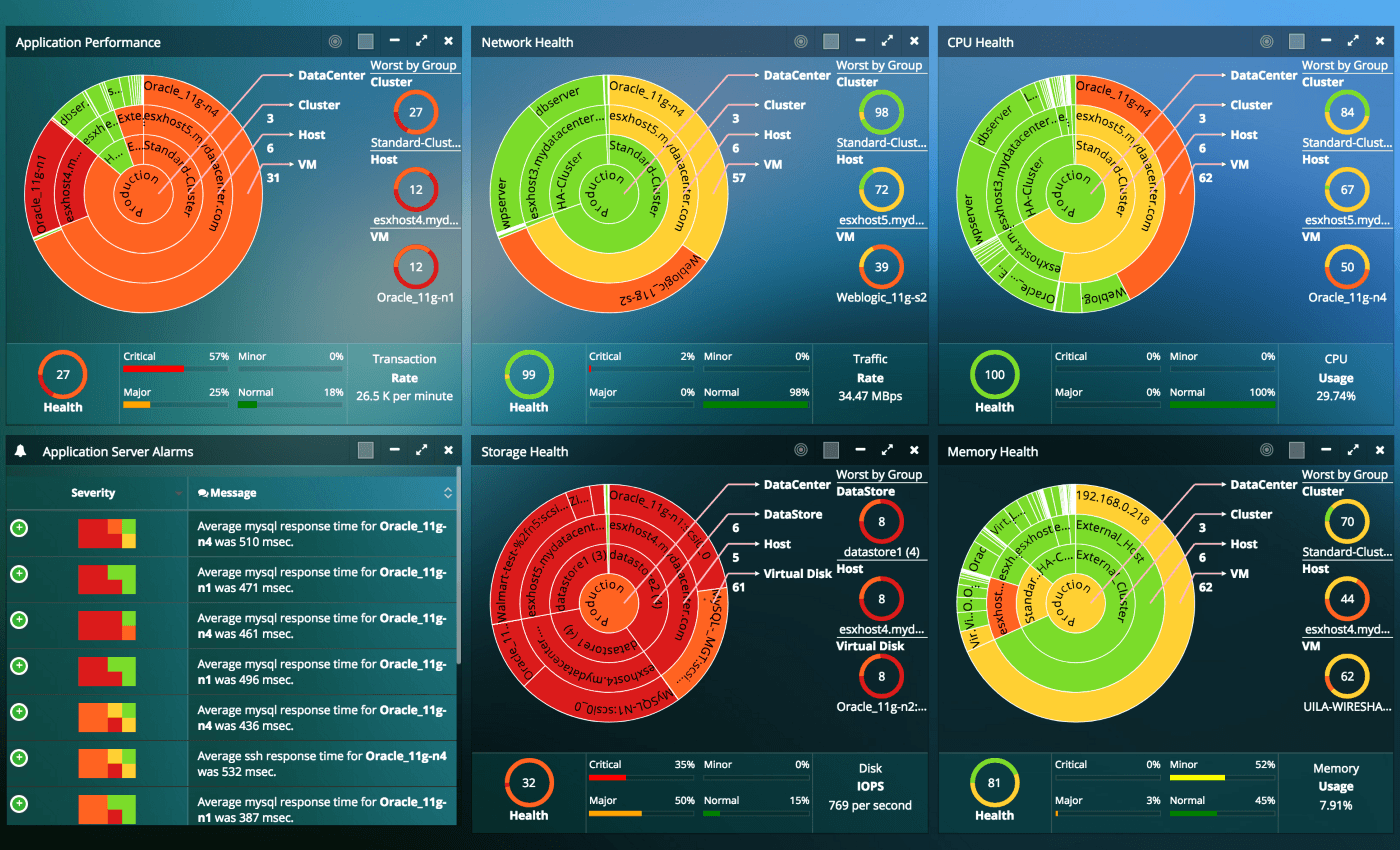
What KPIs Do Network Analysts Use? - The best possible performance of an organization's network infrastructure must be guaranteed by network analysts. For network performance analysis, monitoring, and optimization, they use a variety of tools and methods. The use of key performance indicators (KPIs) and analytics to assess the network's performance and pinpoint opportunities for development is one of the most crucial facets of this position. The list of KPIs and analytics that network analyzers utilize will be covered in this article. The proportion of time a network is operational and accessible to users is known as network availability. This KPI is used by network analysts to verify that the network is up and operating as often as possible, reducing downtime and interruptions to business activities. The amount of time it takes for data to move between two points on a network is known as network latency. This KPI is used by network analysts to gauge network speed and pinpoint locations where latency is impacting performance. Slow response times and a poor user experience may be caused by high network latency...
What KPIs Does a Payment Operations Analyst Use? - The effectiveness of payment operations is essential to every organization. Organizations depend on payment operations analysts that employ a variety of key performance indicators (KPIs) and analytics to guarantee effective payment processes and maximize financial performance. The key KPIs and data that payment operations analysts use to track and improve payment operations will be covered in this article. The total number and amount of payments handled over the course of a certain time are measured by the basic KPI known as payment volume. Analysts can gauge growth, spot patterns, and evaluate the organization's overall capability for processing payments by monitoring payment volume. It aids in assessing the efficiency and scalability of payment systems, identifying possible bottlenecks, and making growth plans. The proportion of successfully processed payments over all payments attempted is represented by the payment acceptance rate. This KPI sheds light on any problems or obstacles clients may encounter when making a payment, revealing the success of payment acceptance tactics. Optimizing payment gateways, reducing payment failures, and raising customer happiness are all facilitated by analysis of the acceptance rate...

What Key Metrics Does an Insurance Operations Analyst Use? - By ensuring that diverse operational tasks run smoothly, insurance operations analysts play a significant role in the insurance sector. To gauge and track the effectiveness of insurance operations, these experts depend on key performance indicators (KPIs) and analytics. In this article, we'll look at the important KPIs and data that insurance operations analysts use to boost productivity, raise client happiness, and improve financial results. Claim Cycle Time: This indicator gauges the typical processing time from claim filing to settlement. This KPI is monitored by insurance operations analysts to spot bottlenecks and speed up the claims process. Claims Settlement Ratio: Based on the total number of claims received, this KPI determines the proportion of claims that were successfully resolved. It aids analysts in assessing the efficacy of claims management procedures. Average Claim Cost: Analysts may see trends and patterns that may affect the company's profitability by looking at the average cost of claims. For monitoring claim reserves and pricing rules, this KPI is important...
What Key Metrics Does an IT Operations Analyst Use? - To fulfill their business objectives, firms must have efficient IT operations. IT operations analysts are essential to managing and optimizing IT systems and procedures. The monitoring and evaluation of IT operations' performance is one of their main duties. They use analytics and key metrics (KPMs) to do this. We will examine the crucial KPMs and statistics used by IT operations analysts in this article to improve IT infrastructure and promote organizational performance. IT operations analysts' first objective is ensuring the availability and uptime of crucial IT systems and services. System dependability may be evaluated and improved with the use of the KPIs and analytics listed below: Mean Time Between Failures (MTBF): The average amount of time between system breakdowns is determined by MTBF. It enables analysts to proactively address prospective problems and helps identify areas that need development. Mean Time to Repair (MTTR): The mean time to repair a malfunctioning system or service, or MTTR, is measured. It helps assess the effectiveness of the incident management procedure and directs analysts to save downtime. Service Level Agreement (SLA) Compliance: The degree to which IT services adhere to the established performance standards is measured by SLA compliance. IT operations analysts may guarantee service quality and adherence to predetermined standards by monitoring SLA compliance...
What Key Performance Metrics Does a Customer Operations Analyst Use? - For every business to succeed, operational effectiveness and customer happiness are essential. Customer operations analysts are essential in evaluating customer data and gaining valuable insights to enhance the customer experience and streamline business operations. Customer operations analysts use analytics and key performance metrics (KPMs) to accomplish these goals. In this article, we'll examine the crucial KPMs and statistics used by customer operations analysts and their importance for promoting customer happiness and corporate success. Customer Satisfaction Score (CSAT): Based on survey results and consumer comments, the CSAT metric calculates customer satisfaction. CSAT scores are analyzed by customer operations analysts to determine overall customer satisfaction levels, pinpoint areas for improvement, and monitor the effects of efforts put in place to improve the customer experience. Net Promoter Score (NPS): NPS measures client loyalty and propensity to suggest a business's goods or services. NPS is used by customer operations analysts to assess consumer advocacy, identify promoters and detractors, and put tactics in place that will boost client loyalty and referrals. Customer Effort Score (CES): The ease with which consumers may complete activities or find solutions is measured by CES. Customer operations analysts use CES to pinpoint areas where customers struggle, lessen their effort, and improve their overall experience...
What KPIs and Analytics Are Used on Aviation Industry Dashboards? - In the field of aviation, making decisions based on data is crucial. Airlines, airports, and other aviation stakeholders shape their operations and objectives in large part because of Key Performance Indicators (KPIs) and analytics. This article explores aviation dashboard KPIs and analytics and how they drive industry growth. One of the most important KPIs on aviation dashboards is On-Time Performance (OTP). The OTP calculates the proportion of flights that take off and land on schedule. Airlines keep a tight eye on this indicator in order to meet regulatory requirements, improve customer happiness, and schedule crews as efficiently as possible. Aviation personnel may detect patterns, identify operational bottlenecks, and take proactive steps to reduce delays with the help of real-time OTP analytics. The proportion of available seating capacity that is filled by passengers is shown by the load factor, a crucial financial KPI. This statistic is used by airlines to maximize revenue and operational effectiveness. Carriers may modify pricing strategies, deploy resources more effectively, and increase total profitability by regularly monitoring load factor fluctuations. By gaining insights into customer demand, load factor analytics help airlines optimize their flight schedules and itineraries...
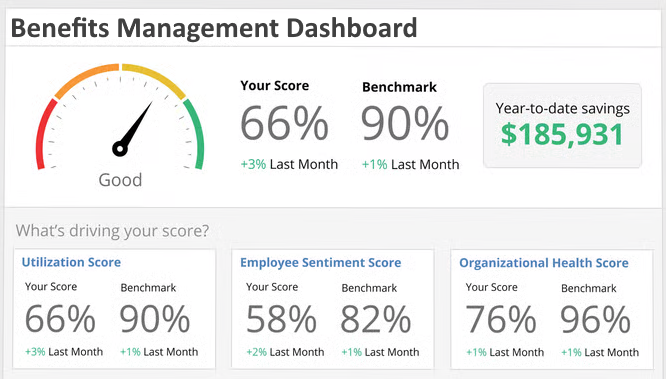
What KPIs and Analytics Are Used on Benefits Management Service Dashboards? - Businesses are using analytics and Key Performance Indicators (KPIs) to help them manage the challenges of managing extensive benefit plans. These technologies give information to improve benefits packages and boost employee happiness. Below we will list the metrics that are found on benefits management service dashboards, what they mean, and how they help measure performance. Management of benefits KPIs are the compass that HR professionals use to navigate the complex world of employee benefits management. Considerations including enrollment rates, use, and cost per employee are essential when assessing how effective and beneficial benefits are. The proportion of eligible workers who engage in benefits programs is measured by enrollment rates, which serve as an indication of their performance. While a low participation rate might indicate that program changes or communication is needed, a high enrollment rate shows how desirable and valuable the benefits being delivered are...
What KPIs and Analytics Are Used on Endpoint Protection Software Dashboards? - One of the first lines of security against a wide range of online attacks is Endpoint Protection Software (EPS). Analytics and Key Performance Indicators (KPIs) are essential for tracking how effective these defenses are being maintained. This article examines Endpoint Protection Software dashboard KPIs and analytics to help enterprises protect their digital perimeters. KPIs pertaining to threat detection and prevention rates are clearly shown on dashboards for endpoint protection software. These metrics measure how well the program detects and eliminates any dangers before they have a chance to do harm. A high danger detection rate and quick preventative action indicate strong security standards, boosting trust in the software's ability to stop various cyber-attacks. Resolving security events quickly is essential to reducing possible harm. Dashboards for endpoint protection software provide incident response numbers in real time, giving users a better understanding of how quickly the system responds to new threats. Quick reaction times demonstrate how adaptable the software is in managing security events, strengthening an organization's defenses against ever-changing cyberthreats...
What KPIs and Analytics Does a Trading Operations Analyst Use? A Trading Operations Analyst plays a crucial function. These experts are in charge of controlling risks, optimizing trading methods, and assuring the seamless execution of deals. They largely depend on analytics and Key Performance Indicators (KPIs) to accomplish their aims. This article explores the vital KPIs and statistics used by a trading operations analyst to manage the complexity of the trading environment. Trade execution speed and accuracy are gauged by trade execution efficiency. This KPI aids analysts in determining any operational bottlenecks and assessing the success of their execution strategy. Analysts may minimize slippage and market effect by keeping an eye on execution efficiency, ensuring that deals are completed at the optimal pricing...
What Makes InetSoft's Analytical Tool Easy to Deploy? - Here are some key features and characteristics that contribute to its ease of deployment: Web-based Architecture: InetSoft's analytical tool utilizes a web-based architecture, which means that it can be accessed and deployed through a web browser. This eliminates the need for complex software installations on individual client machines and reduces compatibility issues. User-Friendly Interface: The tool provides a user-friendly interface that simplifies the deployment process. Users can navigate through the interface and perform necessary configurations without requiring extensive technical knowledge or coding expertise. Drag-and-Drop Functionality: InetSoft's tool often incorporates drag-and-drop functionality for designing and configuring reports, dashboards, and data visualizations. This intuitive approach allows users to easily create and customize their analytical components without the need for complex coding or scripting. Data Source Connectivity: The tool supports a wide range of data source connectivity options, including databases, spreadsheets, web services, and more. This versatility enables users to connect to various data sources without facing significant integration challenges...

What Makes a Predictive Analytics Enterprise - Essentially it is this cross-functional use of data directed from a strategic perspective to inform decision making across the organization that makes you a truly predictive analytics enterprise. What do we mean by that? Well, for example, marketing should interact with risk and understand the profiles of potentially high risk customers. You don't necessarily want to spend money enticing high risk customers to take your product. If you have analytics embedded across the organization at an enterprise level, you can ensure that you are attracting the right customer, and you're spending your money in the right way. Your company probably has a very wide range of individual customers with very different needs, and a significant proportion of insurance today is provided through brokers. Very often the first time a customer makes contact directly with the insurance provider is when they're in the position to make a claim. That makes it very difficult for an insurance provider to build a relationship with their customer. The goal for the insurance provider is essentially to ensure that the experience of the customer within the claim process is a satisfactory one and that it's tailored to the individual needs of that customer. I'd like to show you how predictive analytics can help you know your customer at that individual level...
What Metrics Does a Marketing Operations Analyst Use? - Marketing operations analysts are essential for streamlining marketing plans and fostering firm development. They use analytics and key performance indicators (KPIs) to assess the success of marketing efforts, pinpoint areas for development, and make fact-based choices. We will examine the crucial KPIs and statistics used by marketing operations analysts to assess and improve marketing activities in this post. Monitoring and analyzing website traffic is one of a marketing operations analyst's main areas of interest. This requires monitoring a variety of metrics, such as: Unique Visitors: This indicator shows the total number of unique people that visit a website during a certain period of time. It aids in determining the marketing campaigns' prospective audience size and reach. Pageviews: The total number of pages that visitors see is counted by pageviews. It offers information about user interaction and website navigation. Bounce Rate: The proportion of visitors to a website that depart after just reading one page is referred to as the "bounce rate." A high bounce rate may indicate that the website's user experience or content both need to be improved. Conversion Rate: The conversion rate calculates the proportion of site visitors who complete an activity, such buying something or filling out a form. It aids in assessing how well marketing initiatives perform in generating leads or revenue...
What Metrics Does a Quality Operations Analyst Use? - Keeping operations at a high standard is essential for success and guaranteeing client happiness. The efficiency and efficacy of numerous processes inside a company are closely monitored and improved by a Quality Operations Analyst. To do this, they use analytics and key performance indicators (KPIs) to evaluate performance, identify areas for development, and inform decision-making. In order to improve operations and provide remarkable results, a Quality Operations Analyst employs 18 important KPIs and analytics, which we will discuss in this article. Any successful firm is built on the success of its customers. The Quality Operations Analyst can determine how effectively the company is fulfilling customers' expectations by measuring CSAT. This measure, which is often gathered via surveys or feedback forms, offers useful insights into client sentiment. To improve the general customer experience, the analyst may identify problems and potential improvement areas...
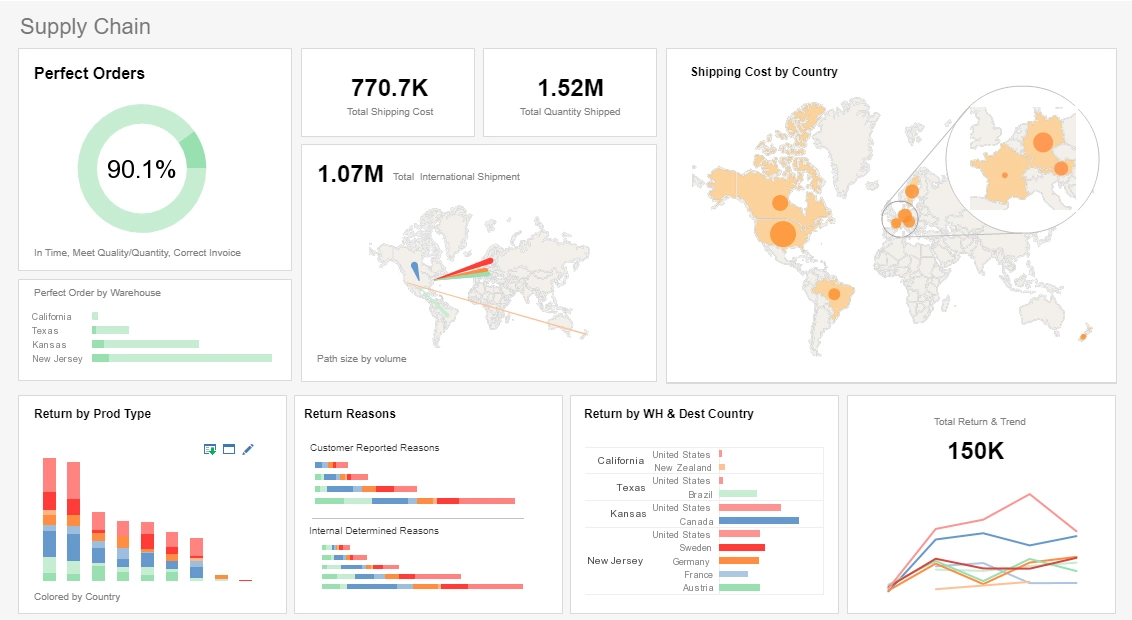
What Metrics Does an Supply Chain Operations Analyst Use? - The effective flow of products and services from suppliers to end consumers is ensured in large part by supply chain management. Supply chain operations analysts play a significant role in this process' optimization by keeping an eye on key performance indicators (KPIs) and using analytics to spot potential areas for development. The performance of supply networks may be improved by supply chain operations analysts using key KPIs and analytics, which we shall discuss in this article. The effectiveness of a company's inventory management is gauged by its inventory turnover ratio. It is derived by dividing the average inventory value by the cost of goods sold (COGS). A high inventory turnover ratio implies that the firm is not retaining extra stock and that its items are selling rapidly, which may lower carry costs and boost cash flow. An important KPI to measure how successfully a business satisfies client demand is the order fill rate. It calculates the proportion of client orders that are fully and promptly fulfilled. A supply chain that is capable of satisfying customer expectations and reducing backorders or stockouts has a high order fill rate...