What KPIs and Analytics Are Used on Waste Collection Software Dashboards?
Businesses are using technology to improve productivity and simplify processes. This change has also been welcomed by waste management, an essential component of urban infrastructure, via the use of advanced waste collection software (WCS).
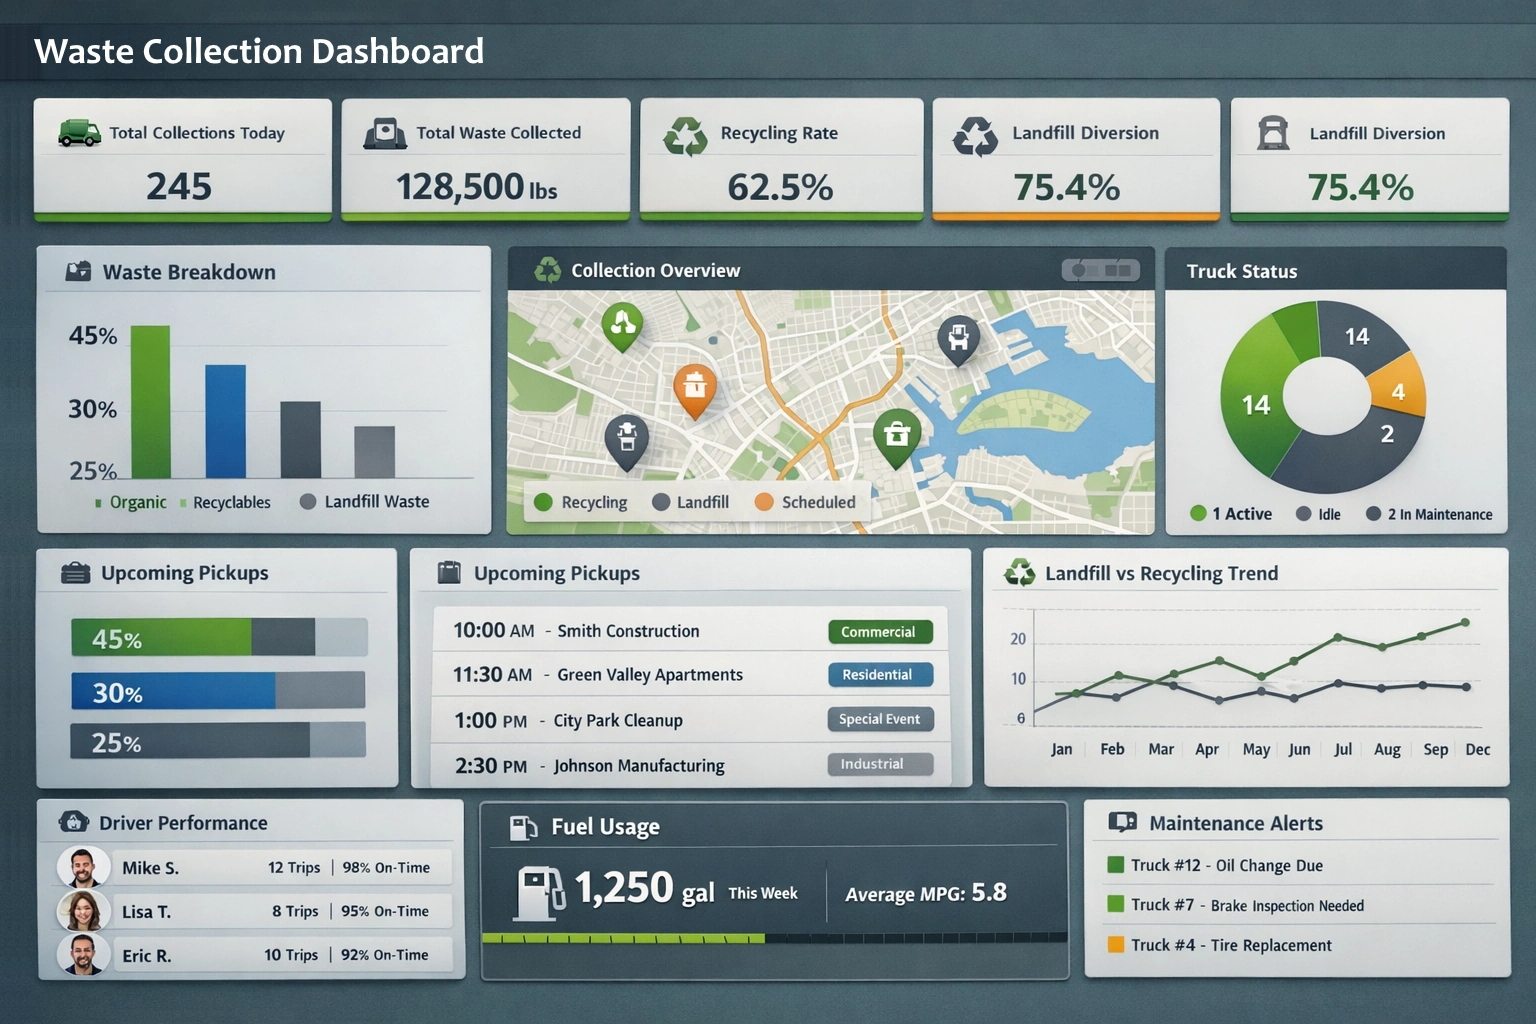
These systems not only help with improved administration, but they also provide insightful data via analytics and Key Performance Indicators (KPIs). We explore the key KPIs and statistics found on waste collection software dashboards in this article, providing insight into how these measurements support efficient trash management.


1. Route Optimization Metrics (Increasing the Effectiveness of Collection)
Optimizing collection routes to decrease fuel consumption, vehicle wear and tear, and ultimately reduce costs is one of the main difficulties in garbage management. Dashboards for waste collection software use a range of KPIs and data to optimize routes:
Collection Density Heatmaps
Garbage management teams may locate hotspots with the use of collection density heatmaps, which show the concentration of garbage in certain places. Managers may make route optimizations to guarantee effective garbage collection in high-density areas by examining these heatmaps.
Fuel Consumption Analysis
For activities to be financially viable, fuel usage must be closely monitored. With the use of WCS dashboards, waste management firms may save fuel costs and improve routes by gaining insights into fuel consumption trends.
Route Completion Times
Monitoring the amount of time needed to finish collection routes helps in determining how effective garbage collection efforts are. Completion time analysis helps identify bottlenecks and optimize routes for more efficient and quick garbage collection.

2. Bin Capacity Monitoring (Avoiding Overflow and Guaranteeing Prompt Pick-Up)
Monitoring garbage bin capacity is essential to efficient waste management since it lowers environmental risks, keeps things clean, and prevents overflows. Dashboards for waste collection software use a range of KPIs and analytics to solve this issue:
Fill Level Sensors Integration
Bins with fill level sensors are a common feature in garbage collection systems. When bins are getting close to capacity, waste management staff can accurately plan pickups thanks to real-time data provided by KPIs linked to fill levels.
Overflow Incidents Analysis
Areas with a high frequency of overflowing bins may be identified with the use of analytics pertaining to overflow events. Waste management businesses might use this information to modify collection schedules or provide more resources to regions that are of utmost importance.
Bin Turnaround Times
Bin turnaround timings calculate how long it takes to fill a bin after waste has been emptied. By analyzing this KPI, collection schedules may be made more efficient, timely garbage pickup can be guaranteed, and overflow issues can be avoided.

3. Metrics for Fleet Management (Improving Vehicle Performance)
Effective fleet management has a significant influence on overall costs and productivity in garbage collection operations. Dashboards for waste collection software use analytics and KPIs to maximize fleet performance:
Vehicle Utilization Rates
Monitoring the collection trucks' usage rates provides valuable information about how well the fleet is used. Improved total garbage collection efficiency and lower operating costs are two benefits of optimal truck usage.
Maintenance Cost Analysis
Finding trends and patterns in vehicle maintenance expenditures is made easier with the use of analytics. By using these data to guide proactive maintenance, vehicle longevity may be increased, operational interruptions can be reduced, and breakdowns can be avoided.
Driver Performance Metrics
Tagging driving behavior, idle time, and route adherence among other aspects of driver performance helps make garbage collection operations safer and more effective. This category's analytics help pinpoint areas that need driver improvement and training.
4. Metrics of Environmental Impact (Encouraging Sustainability)
One important factor in contemporary waste management strategies is sustainability. Dashboards for trash collection software combine analytics and KPIs to assess and enhance the environmental effect of garbage collection operations:
Greenhouse Gas Emissions Tracking
Sustainability initiatives benefit from the measurement and analysis of greenhouse gas emissions from garbage pickup trucks. This category's KPIs assist in identifying ways to lessen waste management operations' carbon impact.
Recycling Rates Analysis
Recycling rate monitoring and analysis functions are often included in waste collection software. Waste management firms may improve their environmental responsibility and encourage recycling activities by having a thorough understanding of recycling trends.
Energy Consumption Metrics
Finding opportunities for increasing energy efficiency may be facilitated by keeping an eye on how much energy cars and waste management facilities use. Energy-related analytics help garbage collection businesses adopt sustainable methods.

5. Metrics for Customer Satisfaction (Guaranteeing Service Excellence)
In waste management, customer happiness is crucial, and WCS dashboards use analytics and KPIs to monitor and improve service quality:
Service Response Times
Assessing how quickly waste management services react to requests or complaints from customers is one way to measure their response. Meeting client expectations and maximizing service efficiency are made easier by analyzing this KPI.
Missed Collection Incidents
Operational deficiencies might be identified via analytics pertaining to missing collections. Waste management businesses may raise customer satisfaction and overall service dependability by swiftly resolving these issues.
Customer Feedback Analysis
Waste management teams may comprehend client attitudes and pinpoint areas for development by integrating customer feedback data. This area of analytics helps to improve services over time.

6. Regulatory Metrics and Compliance (Guaranteeing Legal Adherence)
Adherence to rules is crucial in the field of waste management. KPIs and analytics are used by WCS dashboards to make sure that operations follow the law:
Regulatory Compliance Scores
Evaluating garbage collection operations' compliance level is made easier by allocating ratings based on regulatory conformity. This domain's analytics assist in identifying and fixing any compliance gaps.
Audit Trail Analysis
Keeping a record of all garbage collection operations helps prove compliance with regulations when audited by regulatory bodies. A comprehensive overview of operational compliance with rules is given by analytics associated with the audit trail.
Waste Composition Analytics
It is important to comprehend the composition of collected garbage in order to adhere to disposal requirements. Making sure that garbage is disposed of properly and in compliance with environmental rules is made easier by analyzing data on waste composition.

7. Measures of Operational Efficiency (Increasing Total Productivity)
In waste management, optimizing operational efficiency is a constant objective. KPIs and analytics are used by WCS dashboards to improve productivity and simplify workflows:
Work Order Completion Rates
Monitoring the completion rates of work orders given aids in determining how effective garbage collecting operations are. This kind of analytics helps find operational bottlenecks and enhance workflow procedures.
Route Deviation Analysis
It is possible to get insight into the efficacy of route optimization algorithms by keeping track of deviations from prearranged collection routes. Route planning may be improved for increased efficiency by using analytics pertaining to variations in the route.
Resource Allocation Optimization
Waste management firms can improve the deployment of workers and equipment by analyzing data on resource allocation. The total cost-effectiveness and operational efficiency are enhanced by this KPI.

8. Financial Metrics (Efficient Cost Management)
An essential component of garbage collection operations is cost control. WCS dashboards combine analytics and KPIs to track and manage financial aspects:
Cost per Ton of Waste Collected
The cost per ton of rubbish collected may be used to determine how financially efficient collection operations are. Opportunities to save costs are identified with the use of analytics pertaining to this statistic.
Revenue Generation Analysis
Analyzing revenue sources and trends is crucial for waste management organizations that use revenue generating models. This type of analytics aids in sustainability and financial planning.
Budget Variance Analysis
Financial planning and management are aided by keeping an eye on differences between actual and planned spending. Finding areas where operating expenses can be higher than expected is made easier with the use of analytics pertaining to budget variances.