Data Intelligence for Government
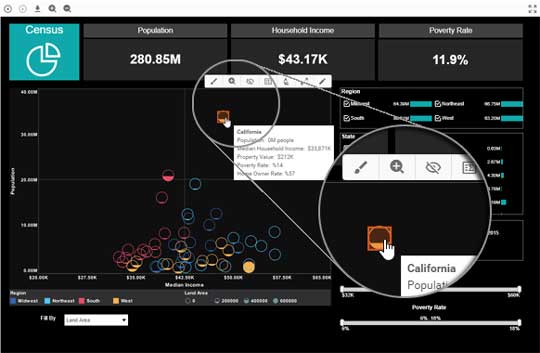
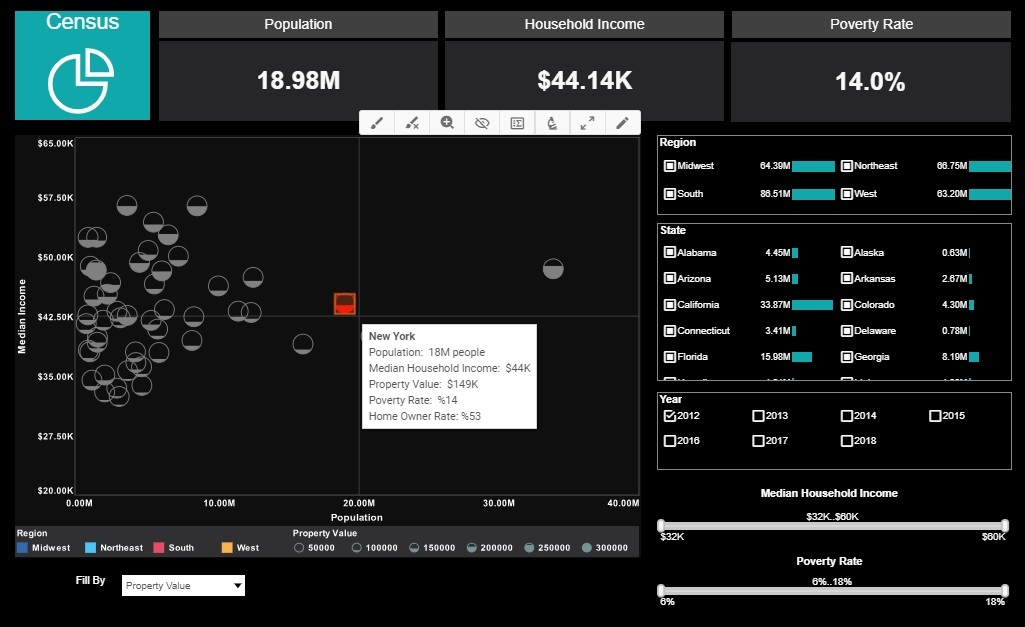
Across all levels of government, there has been a drive for more efficiency and greater transparency. As a result, many agencies and municipalities now want to analyze and share volumes of information with the public and among other agencies in a clear and concise manner.
Business Intelligence for Government
Dashboards and reports must demonstrate how public funds are being spent along with the effectiveness of particular programs. While the IT budget for many of those agencies has increased, efficiency remains the key driver for any IT project. InetSoft's powerful and flexible business intelligence application is well suited to meet those requirements.
Spotlight on Emergency Response Information Reporting
When a disaster strikes, it's crucial to coordinate all emergency responses from federal, state, and local level government agencies. Standard and flexible reporting plays a central role in providing a single version of the truth. Moreover, a disaster could result in a situation where individual computers cannot be networked at the scene. InetSoft's light weight architecture provides the crucial features of desktop deployment that allow for independence from any server support.
After a normal environment is restored, more powerful, server-based reporting and analysis should become available to users again. End users will then resume use of the same user interface, and access the reports in the same way.
Other Business Intelligence Applications for State and Local Government
- Public expenditure disclosure dashboards
- Budgetary control and management
- Educational reporting
- Asset control and assessment
- Environmental monitoring
Some of InetSoft's Customers in Government
- Province of British Columbia
- State of Connecticut
- State of California
- SAIC
Reasons Why Organizations Choose InetSoft


"Customer service is the best I've encountered among software vendors. All the technicians are extremely
knowledgeable, patient and will make every effort to accommodate your schedule and resolve the issue in a timely
manner. "
- Jack P.
"I spent months looking for the best dashboard/reporting app to suit my business. I literally tried and tested every application out there and I have to say that the StyleBI App is by far the best. It is simple to use and it is absolutely brilliant if you are needing dashboards on custom objects." - Jacki A.
How Does the State Department of Motor Vehicles Use Data Visualization?
The State Department of Motor Vehicles (DMV) relies heavily on data visualization for various purposes, including improving operational efficiency, enhancing customer service, ensuring regulatory compliance, and making data-driven decisions. Here are several ways in which the DMV utilizes data visualization:
-
Traffic Management and Planning: By visualizing traffic patterns, congestion hotspots, and accident data, the DMV can collaborate with transportation authorities to optimize road infrastructure, plan new routes, and improve traffic flow.
-
License Plate Recognition and Surveillance: Data visualization tools can help analyze and interpret license plate recognition data, aiding law enforcement agencies in tracking stolen vehicles, identifying traffic violations, and investigating criminal activities.
-
Customer Service Enhancement: DMV offices can use data visualization dashboards to monitor customer wait times, track service efficiency, and identify areas for improvement. Visualizing customer feedback and complaint data enables the DMV to address concerns promptly and enhance overall service quality.
-
Vehicle Registration and Titling: Data visualization assists in managing vehicle registration and titling processes by providing insights into registration trends, geographic distribution of registered vehicles, and compliance rates. This helps the DMV streamline administrative tasks and allocate resources effectively.
-
Revenue Analysis and Forecasting: By visualizing revenue data related to license and registration fees, fines, and taxes, the DMV can analyze revenue trends, identify sources of revenue growth or decline, and forecast future revenue streams. This information is vital for budget planning and financial management.
-
Regulatory Compliance Monitoring: Data visualization tools enable the DMV to monitor compliance with vehicle safety standards, emissions regulations, and other legal requirements. Visual representations of compliance data help identify non-compliant vehicles or individuals and take appropriate enforcement actions.
-
Fraud Detection and Prevention: Through data visualization, the DMV can detect patterns indicative of fraudulent activities such as identity theft, document forgery, or registration fraud. Visualizing data from various sources allows for the identification of anomalies and suspicious behaviors for further investigation.
-
Public Awareness Campaigns: The DMV can leverage data visualization to create compelling infographics, interactive maps, and visual presentations for public awareness campaigns on topics such as safe driving practices, vehicle recalls, or legislative changes affecting motorists.
-
Performance Metrics Tracking: Data visualization dashboards provide real-time insights into key performance indicators (KPIs) such as transaction volumes, processing times, and customer satisfaction scores. Monitoring these metrics helps the DMV assess its performance, set targets, and monitor progress towards organizational goals.
-
Policy Analysis and Decision Making: Decision-makers within the DMV use data visualization to analyze policy impacts, assess the effectiveness of existing regulations, and explore alternative policy options. Visual representations of data facilitate informed decision-making and policy formulation processes.
More Resources About Government BI
Analysis of Government Spending - The Government Spending Analysis Dashboard below provides the perfect solution for the American Recovery and Reinvestment Act of 2009 that forces governments to be more transparent with information regarding the public. InetSoft's technology thrives off of efficiency along with power to provide users with a top of the line and easy-to-manage business intelligence solution...
Civic Decision Making Dashboards - For municipal employees, these positions are of particular importance, since the object of management is the development of the socio-economic sphere of the municipality, therefore, non-compliance with these objective economic conditions can lead to disorganization of the life of the whole city...
Government Agency Business Analysts - If we look at business analysts in state and local government agencies, it's a little bit different story there. State and local government agencies are often played with. And gosh I don't how they do it, but they really are played with a lot. The biggest one of late is because of budget cutbacks...


