Top 20 Management Reporting Best Practices 2026
Contents
Estimated Reading Time: 35 minutes

What Does a Management Report Contain?
Management reporting uses data gathered from several departments, units, and cost centers within a company, through EPR and CPM to facilitate decision-making processes. With the help of management reporting, business leaders can draft a well defined and data-driven judgment.
This article will not only define management reporting but also given different perspectives related to the topic. Various examples of management reports will be illustrated, fundamental practices will be explored and the benefits of digital dashboards will be examined. Accessing digital data that is available to a business and optimally mining its benefits elevates a business leader into a position where he/she can make plausible management decisions, which will eventually propel the business into success. In making a management report, it is necessary to pick key relevant KPIs, which will be displayed on the dashboard.
It is also recommended to have a clear storyline in contemporary management reporting. collaborating with different experts to form a team that exists in a healthy niche, embracing data driven ideas that rejuvenate the business.
Knowledge is an invaluable asset for a business and a business that is data-driven has a great advantage over its competitors. Combining this strategy with BI software, which gives one the power to analyze data in real-time, is a competitive advantage that every business deserves to reap.
Introduction to Managerial Reporting
Management reporting helps businesses make strategic decisions, often using data gathered from several departments, functions, and cost centers, through Enterprise Resource Planning (EPR) and Corporate Performance Management (CPM). With the help of management reporting, business leaders are able to formulate more refined and data-driven decisions. However, the efficiency of the reports can only be guaranteed by the hard work that is done during their preparation and presentation. This article illustrates different aspects of management reports which are credited as the basis of business intelligence.
The framework as well as context of management reports is given considerable attention in this article. Additionally, 20 paramount fundamental practices that can be employed to ensure the reports are efficient are also illustrated. This article also contains examples that demonstrate these practices in the preparation and establishment of first-rate standardized and successful reports, mostly done through online reporting tools. Fundamentally, the aim of this article is to highlight how to formulate resourceful, well-organized, and standardized managerial reports for efficient comprehension by business leaders and other concerned stakeholders. However, before discussing the larger aspects of management reports, it is imperative to understand what management reporting is.
Management Report: Definition
Management reports are conventional business accounts, data pools, and operational information prepared from different organizational departments to enlighten business leaders about the performance and internal operational position of a firm. Business leaders can use management reports to help them formulate clear-cut, specific, accurate, and informed business decisions. Management reports perform a number of functions in a business; often aimed at giving business managers a better understanding of their ventures for effective decision-making inputs. Among the functions are the collection of enormous amounts of data from different departments all over the business, keeping up to date with the organizational dynamics, and presenting key performance indicators (KPIs) at any given point of the business lifetime. The ability of the reports to reveal operational and financial data helps in determining the position of a business over a given period of time.
They present a deep understanding of the wellbeing of the business, which gives leaders the power to make decisions that put the business on the right path, such as improving the efficiency of its operations and increasing its competitive edge. In order to have such a management reporting system, a number of businesses are employing management reporting software, which are professionally formulated to perform these functions. The professional management reporting softwares have incredible visualizations that support their purpose. The visualizations are created with a dashboard creator, ensuring that all the data collected is examined without the chance of an omission. Such thorough examination hardly creates room for human errors that can have negative impacts on a business. Therefore, management reports encompass business data obtained from different departments of an organization to tell the business leaders about the performance and internal operational position of a business.
Beginning with Financial Reports
Financial reporting is a familiar concept for any business owner, considering that its main function is relevant in "documenting a company's past financial performance, projecting a company's future financial performance, assessing the credit quality of a potential debt investment, and screening for potential equity investments." The reports are most often compiled after the specific business operations are done, and are often prepared following the conventional GAAP (Generally Accepted Accounting Principles) guidelines. Thus, in the conventional reporting activities, analysts often adjust a company"s reported financial inputs to enhance their absolute accuracy/comparability with the financial reports of other companies.
The main reason financial reports are compiled is to serve their essential legal purpose. Unfortunately, unlike management reports, financial reports hardly serve the purpose of influencing decisions in a business. The reports give a general view on the growth and development of a business. However, they lack the actionable recommendations and insights, which are important for strategic operations of a business. Financial reports come as an after-thought when decisions and operations have taken place, thus are very slow in influencing critical actual decisions beforehand.
No matter how fast the financial statements are given, no decisions are made from them. Getting accurate and timely financial reports, which focus on the future of a business (hence influencing change) has been a challenge in the past, currently, and probably in the future. There is a mismatch between the potential value of financial reports and reality, as financial reports were never intended to be useful in the traditional business setups or before legal obligations demanded such reporting inputs. Thus, financial reporting is intended to meet legal obligations, as they use past information, and are used by various interested parties (including shareholders and investors) to make critical decisions about partnerships or future relations with an organization.
Making Financial Management Reports Important
The aforementioned mismatch of the usefulness and reality of financial reports has resulted in some business attempts to make their reports to serve additional roles besides the legal obligations. The objective is achieved by creating financial reports with supplementary information useful for decision-making. In as much as these newly created advanced financial reports have particular advantages, they also have an enormous downside. The reports are increasingly more intricate and take a lot of time to create. Conventionally, financial reports have a legal time limit and when tasked to include more information than normal, they might attract some erroneous details or fallacious entries due to the rigorous process and time limitation.
The attempts to convert financial reports into management reports are strongly discouraged. As a result, the solution of separating financial reporting and management reporting was hatched. Most of the information used in financial reports is also utilized in management reports. The difference is only that the information in management reports is offered in a more constructive method to discern the operational inputs and outputs of an organization.
An example can be seen in the management dashboards, which are interactive in nature and encompasses assorted operational dynamics. Thus, a firm's financial management reports help in the evaluation of its historical performance, addressing the business dynamics and the influencers of the company's performance, which affects the overall operational strategy
In addition, the reports can help in addressing questions faced by managers, such as when to hire and how much to spend on hiring, the profitability of clients, if there is sufficient cash to pay workers, or where to spend the cash for marketing among other important questions. In as much as these questions seem to focus on the financial part of the business, answering them would need a report that is more focused on decision-making protocols rather than legal purposes.
In reality, reporting based on data is a part of business intelligence that has existed for some time. However, the type of reporting that is currently being used has been significantly changed due to the introduction of dashboards, predictive analytics, and big data collection tools. Prior to discussing the fundamental practices, it is important to take note of the differences between financial and management reports.

Top 20 Fundamental Practices, Examples & Templates
A clear illustration of what is entailed in management reporting and its functions have been discussed earlier in the post. Now it is necessary to discuss the fundamental practices of management reporting. The post will look at 20 important management reporting guidelines, while exploring different examples of management reports and taking into account how to use these guidelines in various kinds of management reports.
Setting Strategic Goals and Objectives
Before embarking on the journey of formulating a report that has several elements, it is important to first to visualize the end result. Beginning to write a report while thinking about the outcome helps to create a path that will ensure that all of the requirements of the report are met. Critical questions, such as why the report is needed, the purpose the report is intended to serve, and how the report should look at the end, are important at the initial stage of report formulation.
Questions concerning data analysis in the report must also be considered as they will be essential in tackling the requirements of the report. The moment the "what" and "why" questions on the report have been answered, then it become very simple to position the key performance indicators. These indicators will be important in tracking the specific aspects of business performance. No further step should be taken into reporting without having at least two goals or objectives in place. Therefore, it is crucial to clearly set the main objective of the report and answer critical questions that will guide the structure and content of the management report, despite the challenges.
Select the Appropriate KPIs for the Audience
Key performance indicators (KPIs) are important to establish the directions of a report, especially in line with the objectives of an organization. The focus of a management report should therefore focus on a selected few KPIs. It is important to know which KPIs are relevant and effective. The relevance and effectiveness of the KPIs is determined by the audience. The audience's job function as well as their rank in terms of seniority level will be considered. For example, a junior marketing manager and a junior sales manager have different job functions and thus will need different KPIs.
The same is applicable to the head of sales and junior sales manager, who will also need different KPIs. Having an efficient KPI management is essential in management reporting. Nevertheless, it is a very challenging task for managers to choose the right metrics to use in choosing the KPIs. Therefore, the key to finding the right metric is to try and determine the data-drive question that the audience of the report is seeking the answer to.
Determining these questions and their answers will help deal with the expectations of the audience, while achieving an effective and beneficial reporting. Therefore, setting KPIs for different departments or leadership levels is vital in the design and preparation of management reports as it gives an organization a clear purpose and scope.

Consider Customer Feedback
Customer feedback is an integral part of a business, as it gauges the performance of the business based on its ability to cater to its clients, resolve complaints/disputes promptly, and change with the market trends. Customer feedback can either be good or bad, however, what is important is that it relays information back to the business digitally by communicating what is right and what needs to be improved. The customer feedback is analyzed using the customer service analytics. The analysis of customer feedback and creation of a report out of the analysis can be helpful in the formulation of a digital strategy that is based on data collected.
For instance, the reporting insights can be used to improve customer service measures, improve usability of an organization's website, communicate the new objectives of the business to the key stakeholders, illustrate the vision of the organization in a contextual manner, and integrate marketing inputs in a selective manner. Therefore, management reports should be prepared with the customer feedback in mind to ensure that the organization's vision is in line with the expectations of the customers and the dynamic market trends.
Enhance the Data Storytelling Proficiency
Proper presentation (in terms of visuals) of the collected data and prepared information ensure that the report is memorable, easily understandable, and interactive. The future of management reporting relies on accurate synthesis and attractive presentation of data and figures, focusing more on the style and how to present the raw content. In this regard, human beings are primarily persuaded through three different types of information: context, content, and meaning. When a story is told using the data on the report, it is imperative to use the three pillars to enhance the credibility and significance of the report.
Apart from the actual data and figures collected for a report, the style by which raw data is presented is also an important practice in management reporting. Generally, organizations should incorporate rich content, relevant context, and accurate meaning in their management reports to ensure that they remain relevant and consistent in their reporting inputs. When telling a story, it is possible to use all the three features to persuade the audience, which can be achieved by:
- Presenting the story in a systematic manner, using historical data and time periods, which is critical in the management reporting quests. Stories should always have a start, a middle, and an end structured in a constructive manner. Presenting data following a particular trend can result in something analogous to a story. For instance, the report can make a comparison between revenues in same quarter in different years.
- Forming a contrast between various KPIs and metrics. For instance, presenting a target number against the actual number achieved.
Enhance Visualization Through Focus
The processing of data by the human mind is only limited to a given amount of data at a time. When the limit is surpassed, the mind becomes weighed down, which can eventually result into decision fatigue. A management team that is going though decision fatigue is not capable of making appropriate strategic decisions. Therefore, it is important to remember to keep information to the minimum when reporting. It is generally acceptable to display between three to six KPIs on a report. Any number that exceeds six is strongly discouraged.
Nonetheless, presenting other data on the report other than KPIs is not discouraged. The data has to be presented in the report in such a way that the KPIs are given the visual significance they deserve. The most important spots in the report are occupies by the KPIs. The secondary and tertiary spots can be occupied by the other data like metrics. Having a modern high tech online dashboard system enables the development of fast unproblematic KPI dashboards which are interactive. This becomes the best asset when there is need to pass information.

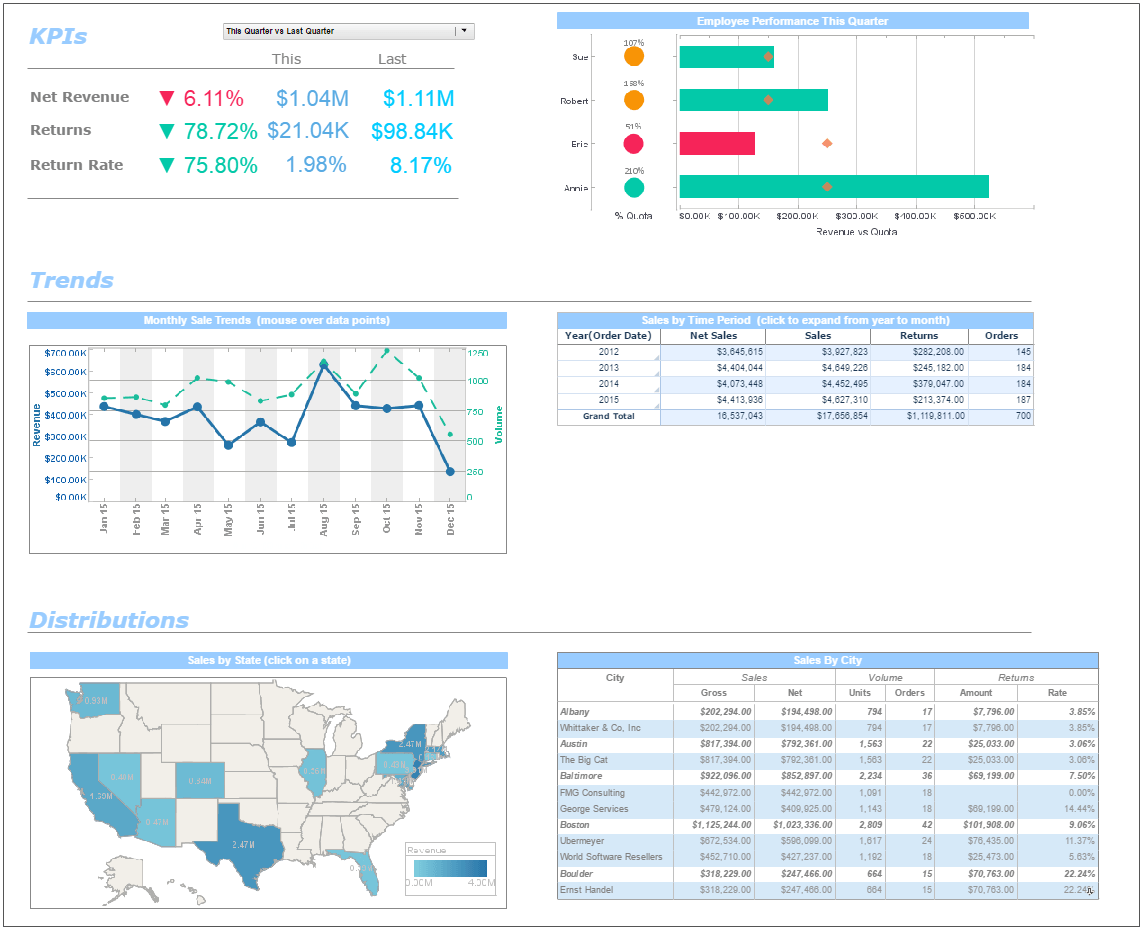
Consider Human Intuition in Your Visuals
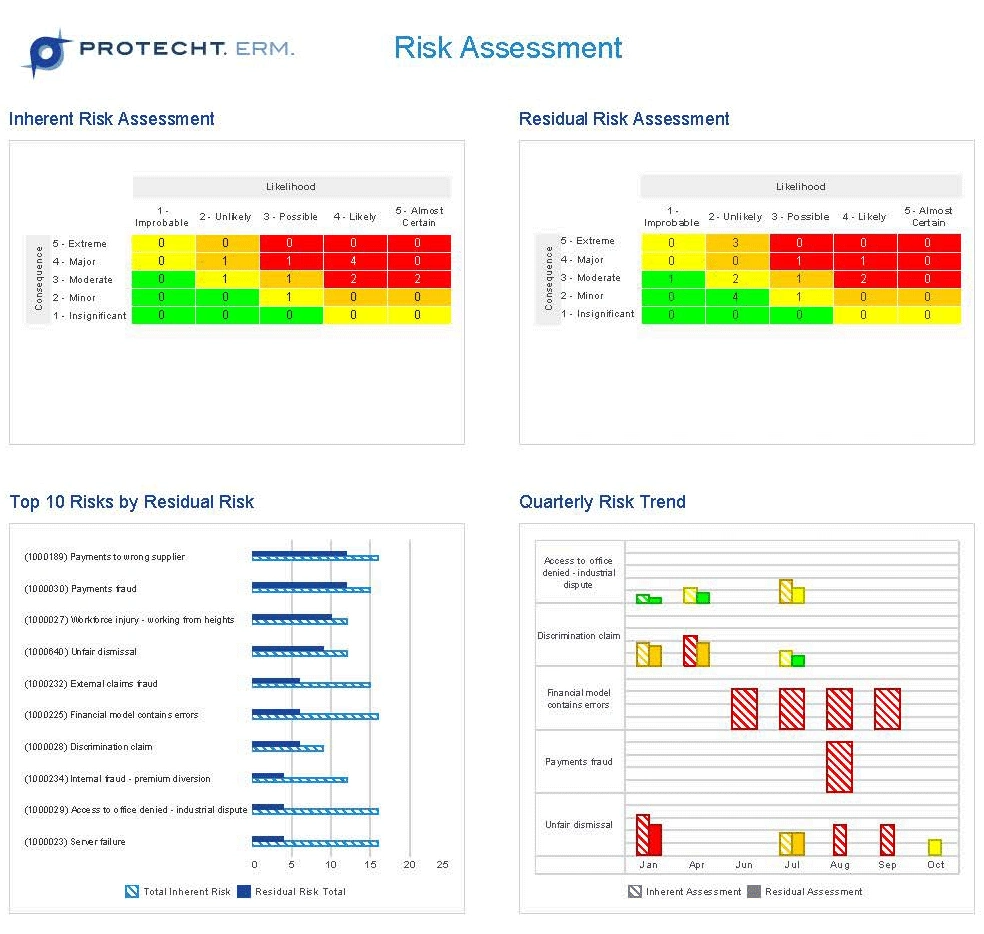
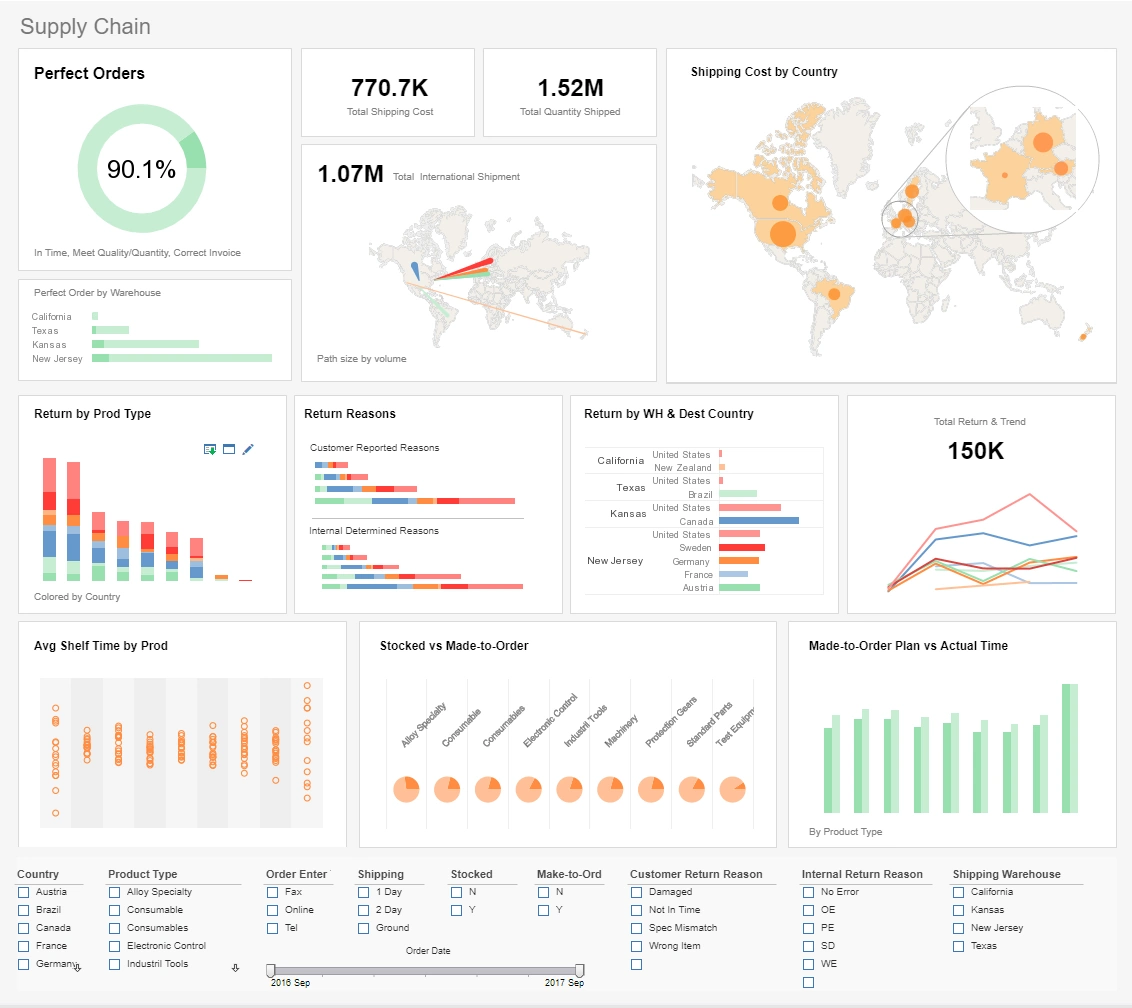
As hinted before, visuals are a very important aspect of communication as they not only enrich the communication but also make it flexible. Visuals in management reporting are used in different ways in colors and graphs. Color is a basic element in visual communication. As a result, it has also been used in analytical situations to give a bigger picture of a matter or enhance understanding of an organizational situation. Apart from the layout and the few elements one chooses to place it on the one page dashboard, color is another aspect that will be immediately visible to the users. The colors used can either be appealing and receptive or repulsive. In as much as the reporting systems are digitalized, human intuition plays an important role in determining which visuals are appealing to the users.
The image above is a good example of how human intuition influences visuals. The visuals use green and red which are not only two distinct soft opposites but also are associated with certain aspects. Red is associated with negative results while green is associated with positive results. Therefore, a KPI in red or green means it has either improved or deteriorated. The use of colors in the presentation of management reports is critical and should be contextual to the key issues presented. In this regard, enhancing the visual appeal of the report can promote its attractiveness, enhance comprehension, and guarantees scrutiny from the target stakeholders.
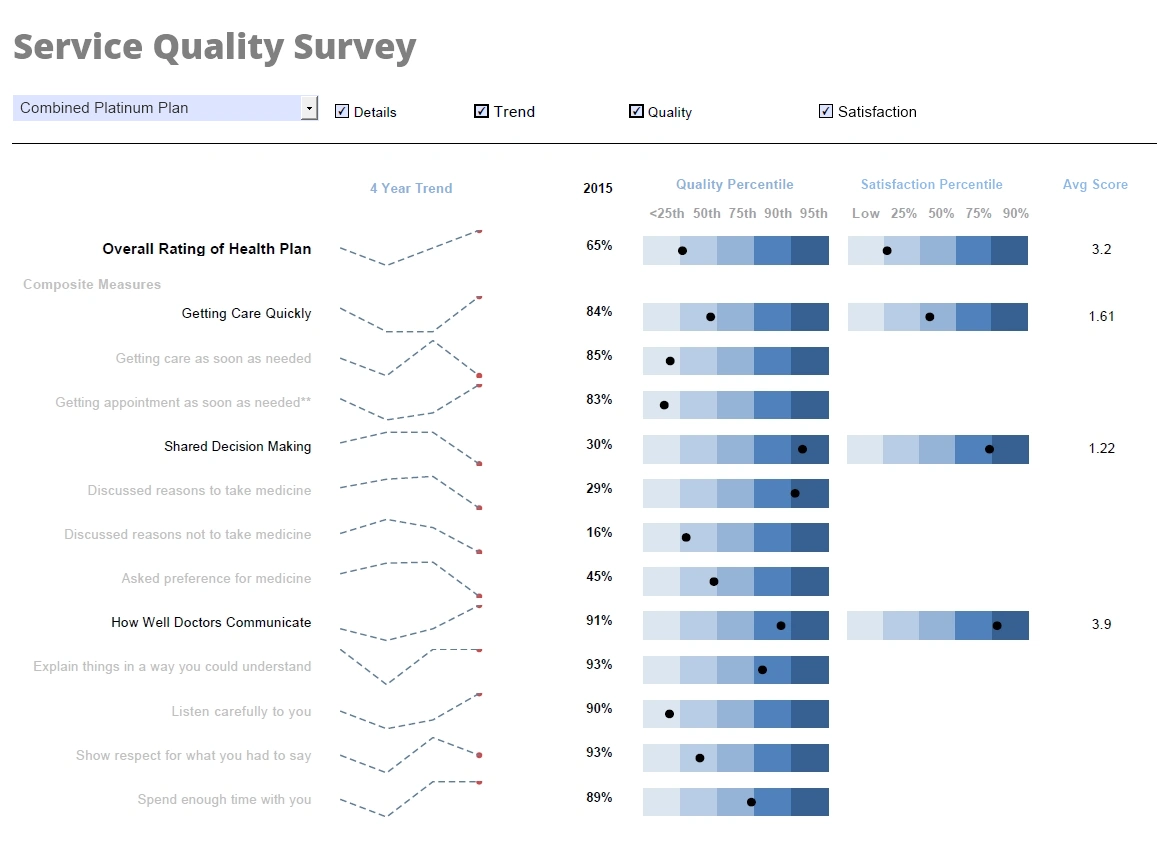
Promote Clarity in Your Managerial Reports
It is also crucial to promote clarity in a report to deepen its understanding. Clarity is an important aspect of both business writing and management reports. Clarity in this context can be achieved by a number of methods:
- The designing of a dashboard has guiding principles that need to be followed. The principles include ensuring that the colors used are carefully chosen and prominently standing out from each other. Additionally, there is a need to have some blank space to avoid overcrowding of the content.
- A focus on details approach is important to enhance clarity, accuracy, and reliability. For example, each and every KPI needs to indicate whether neutral, good, or bad, which can be done by having real values against expected values.
- The metrics to be used in the report need to be ordinary, familiar, and ones the audience have encountered.
Therefore, clarity of the content presented in a management report can aid the projection of a firm's performance and future growth in terms of cash flow, top-down sales forecast, analyst forecasts of the industry sales, as well as a company's market share. In addition, by clarifying the projection of profit margins/expenses as well as the level of investments, analysts can predict net income and cash flows of an organization to relate how the management/leadership inputs have influenced the figures.
Digitalize
The world has increasingly improved its digital prowess, and so has the business sector. Businesses have over time done away with analogue practices in their different sectors and adopted digital systems.The same is also a necessary practice in management reporting. The old reports written on paper have to be traded for digital versions.
Online reporting software is a huge investment for a business as they present the business with continuous instantaneous updating abilities, reducing losses and wastes and thus saving money.
Apart from their interactive nature, the digital reports are collaborative and thus can be jointly worked on by a team. Putting management reports in a digital form can enhance their accessibility to various stakeholders, improve their durability, and enhance their convertibility to other readable platforms for extensive use by the stakeholders.

Strike a Balance
Previously, clarity was mentioned to be one of the fundamental practices necessary for an effective report. The clarity ensures that management reports are easily digestible by the audience. Another way to improve on digestibility of reports is by balancing the data with visuals, that is, striking a balance between the presented content and the dynamics of the market.
The visualizations of the report need to work cohesively at providing the right information to the audience without making them confused. Clashing visualizations causes confusion that impede proper understanding of a report and compromises the decision-making process, lowering the utility of the report.
Selecting the types of visualization to employ requires the use of the design principles discussed earlier. The graphs, charts, and other visualizations used in a management report are supposed to provide the needed information. They are also supposed to limit confusion and waste as little of the readers time as possible.
Utilize Multidimensional Charting
Multidimensional charts are important in providing additional data as well as relationships between various measures. However, there is a limit to how much can be included in a given chart. A simple line graph or bar chart with the y and x axis used to display data can easily be interpreted by everyone. However, the more measures and different dimensions are included in the chart, the more it becomes "confused" and cannot be interpreted by anyone.
The benefit of a chart is determined by the data as well as the insights the chart is intended to give.
However, the guiding rule to using multidimensional charts is having one or two more dimensions like color on a bar chart or different sizes and color on a bubble chart. Therefore, it is crucial that the use of a multidimensional charting helps in enhancing the presentation of data and displaying information in a comprehensible manner.
Make the Report Scannable and Drillable
Two important functionalities are gained form going digital in management reporting: interactivity and customization of the features in the report. Digital management reporting is absolutely essential in the current tech-savvy business environment. Digitizing reporting is one way to keep up with the continuously changing business sector. Customizing the features on the report and having an interactive system allows for the creation of perfect data visualization and design. These techniques constitute the core excellent practices enabling the management report to be drillable and scannable. The feature also allows the document to be accessible to many interested stakeholders in the digital space.
In addition, a drillable report is one that avails information that can be explored further in order to get more information that is not readily available at fast glance. For example, a report needs to provide real time business performance, while at the same time giving a comprehensive trend of the business performance. A scannable report, on the other hand, is one that avails the needed information as easily accessible as possible for the audience to pick without much work. Thus, management reports should prepared in versions that can be scannable and drillable in diverse aspects.
Save Relevant Real-time Data
Making real time data the most outstanding on the dashboard is essential in evoking insights, which can be used in decision-making processes in the business. As discussed earlier, management reports need to present data in a story telling format, have well balanced KPIs which represent the current, past, and future business scenarios.
However, the most important aspect of data presented in these recommended formats needs to be real time and at the same time line up with the objectives that were set at the initial step of reporting. Notably, real-time data enhances the credibility and relevance of the report, while also helping in comparing the gathered information with other relevant information in the related sectors.
The following steps needs to be taken in order to ensure that the real-time data lines up with the primary goals of the report.
- Keep on revisiting the key goals that were earlier set as well as the KPIs that were selected and examine them further in order to determine whether the real time metrics to be used also tell the story of the company performance, and are beneficial to the audience.
- Testing the benefits of the report is important in determining the influence of the report in the decision-making process, and assisting in achieving the goals which were set. The testing can be done by running the report for a specific period, like a week, before adopting it.
- Testing the report is to be not only done by one department but by several key departments in the business. During the presentation of the reports, feedback is necessary in order to make changes that improve the efficiency of the report.
Employ Predictive Analytics & AI
Other than the basic management reporting systems that have been adopted by businesses, there are also advanced management reporting systems that are more sophisticated but provide better results.
Investing in a management tool that can extort the greatest potential out of a management report is integral in this case, as it will make the reporting process automated and thus simpler and time effective.
There are a number of analytic tools available for businesses. These tools are capable of providing the benefits mentioned above.
Predictive Analytics:
Involves several statistical techniques like data mining and others. It uses the analysis of current and past data as well as statistical modeling in order to predict the future. Predictive analytics are very important tools in the decision-making process. The predicted future performance of a business can help leaders to make fitting arrangements. Additionally, leaders can also pick out potential dangers before they become a reality.
Artificial intelligence (AI)
The purpose of management reports is not to complicate things but to make work easier. Therefore, taking up the benefits that come with AI makes managerial work efficient. The speed and efficiency of AI in reporting cannot be compared to any human capability.
Other than speed, the AI can be important in comment monitoring, fact checking and other functions. AI tools like InetSoft learn from tendencies and patterns from the data collected over time and thus can sense and send notification when an unusual action happens.
Predetermined goals and targets are set and the AI keeps the reports up to date with goals as they are met. Therefore, critical and effective preparation of management reports demand the use of predictive analytics and artificial intelligence to enhance the certainty and understanding of the available data and use the same information to foretell the future trends of the market and the industry at large.
Encourage Continual Growth
Any type of report dashboard, whether in financial or management reports, needs to go through continual upgrading to ensure that it is offering relevant and actionable information. The world is regularly changing, with technology becoming a necessity in all sectors.
The constant global change is also shifting the business environment, thus altering the goals, strategies, and initiatives in order to keep up with the landscape. Testing reports periodically ensures that irrelevant information is removed from the reports, making them suitable for use in decision-making processes.
Additionally, inefficiencies in reports are corrected in the process, making the reports perform their roles as intended. The periodic test can be conducted by the visual analytic tools to make sure the reports are beneficial. Thus, management reports should be presented in a manner that encourages continual growth and establishes organizational projection of the market trends.
Encourage Collaboration in Your Managerial Reporting
The clarity, direction, and insight offered by management reporting systems are immense. In order to get the maximum benefit possible from the management reports, it is necessary for the reports to be formulated while taking the landscape of the business in to consideration. The finest method of considering the business needs is to involve the whole team in the reporting process.
Collaboratively working through the management reporting process helps in getting feedback that is used to make the needed changes to the reports. For example, presuming that a manager in charge of financial management reports needs to make a report that is beneficial to the business, they need to have a team that is made up of experts that work in the business.
This team of experts will be tasked with the mandate of collecting and assessing the pertinent KPIs and metrics for the report. Therefore, collaborating with several stakeholders within an organization and beyond can help in drafting a quality management report with expert insights incorporated for accuracy, credibility, and functionality.
In addition, having a team that is dynamic and have diverse professional insights ensures that the weaknesses of the management report system are identified earlier enough and corrected. The weaknesses can be in the form of redundant data, inefficient layouts, or obsolete visualizations among other faults. A dynamic team helps in capturing all the valuable insights and makes sure the tools give their maximum benefits. Notably, the current management reporting tools are flexible and offer around the clock access, and thus all involved parties can remotely communicate their insights at all times. Thus, it is crucial to engage dynamic and diverse professional insights to ensure that the weaknesses of the management report system are identified earlier for any potential corrections to be made.
Build a Sense of Cohesion & Consistency
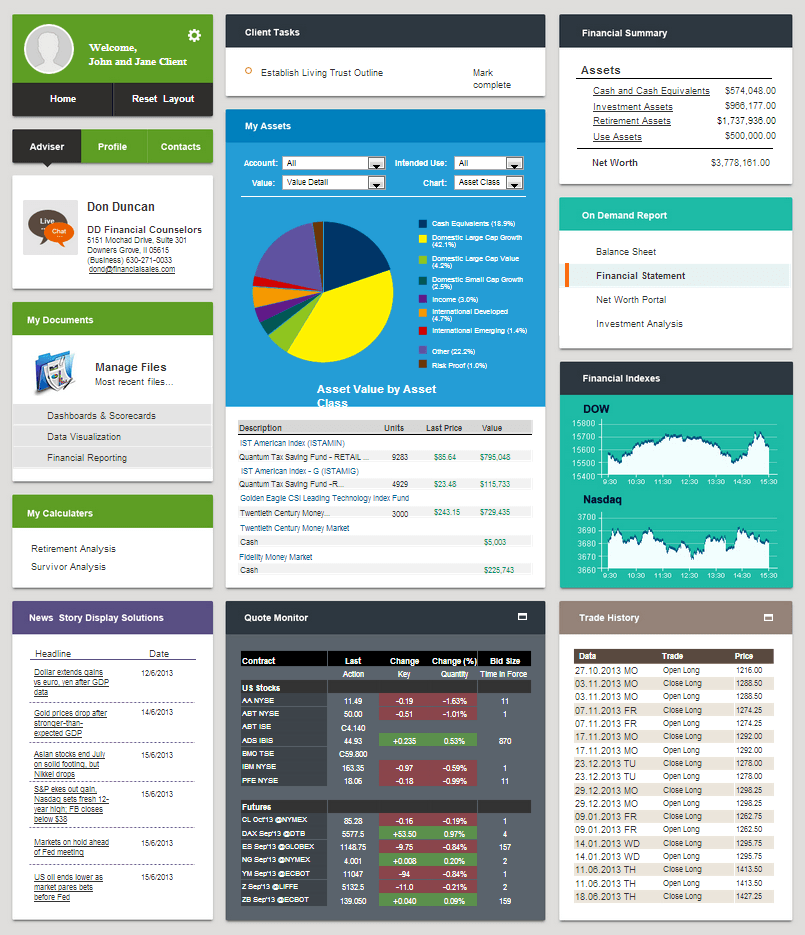
The digital management reporting systems are known to be dynamic and contain several components. The systems have balanced blend of scannable visuals and drillable KPIs. For example, a CFO manager can prepare a report that illustrates the visual cohesion and consistency between key element included in a report.
The report shows a relationship between financial performances, economic value, and employee satisfaction, which is shown in a coherent manner allowing for quick decision-making on initiatives to be taken. Therefore, reports should be prepared with skills that demonstrate a sense of cohesion within the organization (for example amongst departments and within teams), while also demonstrating consistency within the report structures and information presented.
Classify the Data Efficiently
Compartmentalizing the management report system dashboard is important, as it minimizes any technical issues that can arise from the data collected. It also reorganizes the processes which are technology based, improves the rates of attrition of the team, and anchors fresh developments. When formulating a report, after consigning the data and KPIs, it is important to analyze each and every element present in the report and put each in the correct compartment.
Proper classification of data and structuring of their contents helps users to access the information they need easily, organizing the report in a refined manner, and demonstrates professionalism in the preparation quest. For example, it is crucial to create a CTO dashboard that is properly compartmentalized and resourcefully planned. The dashboard should show key information which is further split into boxes to give further information (mostly under fresh subheadings).
It is advisable to label compartments clearly with data, visualization, and robust insights. Therefore, proper classification of information within a management report not only improves its suitability and organization but also enhances its professionalism, guarantees the authenticity of the presented information, and facilitates the accessibility of the compiled report.
Generate a Scannable Timeline
Timelines enable the report to present the past, present, and any predicted data in a visual and scannable manner. The aim of the timeline is to create clarity in a management report with numerous key aspects to present. A scannable timeline provides users with a report with a deep understanding of strengths and weaknesses of a business. It also focuses on the strengths of a business such as the offering of rewards, trainings, and support where necessary.
In addition, some scannable timelines have dashboards that give a clear representation of facts, emerging ideas, and possible market trends. Such a dashboard can be successful because it gives a concrete timeline of data. Drilling down or across the dashboard would give past, present, and predictive data. Therefore, a management report should be able to generate a scannable timeline to facilitate navigability by the users.
Apply Self-service Analytics Tools
Financial and management reports are documents for a business and access to them should not be limited to a few leaders as was done in the past. In the current era where businesses are information based, the success of a business is determined by how willing they are to share the benefits of documents like management reports with everyone. The benefits can only be experienced by all if the reports are made accessible for all.
The access can be achieved by having a self service analytical tool, which is used by businesses to assess and visualize their data without the need to have any expert training. InetSoft is an example of such a self service tool as it is consumer friendly and has spontaneous dashboards that allow everyone in the business to access data and create reports in a short period of time.
A business that is open to using such tools can benefit from them as they get access to important data used to improve their performance and identify opportunities. In this regard, self-service analytic tools lessen the burden of collecting, organizing, and presenting credible data about an organization; it simply facilitates the process.

Promote Data-driven Culture
Self-service tools foster a data based culture in an organization, which is a priceless asset for any business. The culture of a business is how a particular business operates internally and how it interacts with both the internal and external environment. The culture of a business has a significant impact on how employees interact with clients and affiliates of the business. It also determines how those in the external environment view the business. Thus, using data-driven management reporting enhances the credibility of the reports, promotes the authenticity of the data used, strengthens the analysis made, and anchors or informs the decisions that an organization takes to churn its way forward into the uncertain business environment.
In addition, everyone in a company needs to understand how data is important to the business and their role in protecting this priceless company asset. Everyone needs to adopt the use of reporting systems that will not only improve their performance while making work effortless but also increase the company productivity. Fostering a data driven culture can be done by having regular data meetings, which clarify the benefits of data reporting and have workshops that train everyone on how to utilize the tools.
Management Reporting
History and Trends
Previously, legacy systems were the main computing system used. Currently, there are businesses which still use the legacy system due to different reasons. The legacy system is still capable of fulfilling the purpose for which they were initially designed. However, the system does not permit growth, which is a significant aspect of any business that needs to survive the current dynamic business sector.
The system has presented businesses with significant drawbacks as it is not capable of interacting with newer systems. Its purpose can hardly change to encompass the new challenges facing the business. The progression that is exhibited in the technology sector has made companies face challenges that are mainly brought about by the legacy systems.
In addition, legacy systems do not have capabilities of computing systems like cloud computing and data integration that is done by the modern systems. This system keeps business in a pothole, which they only get out of if they choose to drop legacy system and adopt newer systems.
Legacy systems are also complicated and needs experts to operate, which creates a lag time for a manager to want to see a report and the actual time they are able to get the report.

Using the Deloitte survey (as a case study), it is possible to realize how much management reporting has increasingly become essential and see different viewpoints on it. Business leaders are no longer interested in financial reports, which do not give them insights on important decisions to be made for the businesses to grow.
In as much as financial reports of a business are significant, the present flexible management report is more beneficial as it provides data to predict a trend as well as the reason behind such a trend. Such information can help the leaders to get to the root cause of a problem and make useful decisions.
According to the Deloitte survey, in as much as the managers are interested in taking on the reporting practices, just 24% of reporting time is utilized in analysis and strategy building. The majority of businesses are still using a huge amount of time in report formulation. In fact, half of the survey respondents are discontented with the time taken to deliver the reports and content of the report.
On the other hand, the appropriate management reporting systems for businesses today must have a good blend of both internal and external data that is in real time. This data makes it possible for the business to find insights and perspective into their performance. Management tools, for example, InetSoft, present business with a single management system that performs several functions, as it presents automated reports in business dashboards.
The Purpose of Reporting
Recognizing a good management report is important as not all reports serve their intended purpose. An excellent report has a number of qualities like relevance, clarity, timeliness, accessibility, and automated features among others.
When all the qualities of a good report are met the reporting system is capable of giving data that is used to identify weaknesses. Therefore, managers need to use prudent management reports for several reasons:
Evaluating Strategic Metrics in Order Monitor Performance
All businesses require a method of gauging their performance against their competitors. Additionally, they need to assess their performance against their set goals. Assessment of business performance allows for growth.
Helping to Determine Wellbeing
Among the elements present in a management report are the performance metrics that identify the position of a business. The position a business occupies is its health as well as growth possibilities. It is alright to compare these with competitors and make strategic changes when needed.

Setting Specific Performance Target
The collected information from the business shows a trend that can be used to set targets. The targets can either be financial performance or operational performance
Learning
The targets set serve as a guide that indicates what is effective and what is not. The reports give knowledge on the best actions that need to be developed and the wrong actions that should be dropped and avoided at all times.
Improving Communication
The reports are a team effort and thus provide a chance to improve communication in different departments within the business. Additionally, communication with external stakeholders like investors and customers is also enhanced.
Enhancing Collaboration
The improved communication results directly into improved collaboration among departments. Reports that are of senior level bring a larger team from all over the business which gives them a chance to work on different initiatives together.
Heightening Commitment & Motivation
An excellently presented managerial report provides the company with critical data that is easily accessible thus improving performance at individual level.
An improved performance can attract attention and recognition, which will have a direct impact on the commitment and motivation of individuals.
Promoting Incessant Business Growth
A good reporting system improves the decision making process which in turn increases productivity. When the production is consistent, the business will definitely experience continuous growth. Continuous and consistent growth for a business ensures sustainability and thus the business experiences lasting success. Lasting success is the most powerful benefit of management reports.

Getting Started with Management Reporting.
How do You Write a Good Management Report?
There are a few guiding principles that need to be followed when getting started with management reporting.
When Preparing Reports, Clean Data Always
When inaccurate data is fed into the system, the results be inaccurate. There is no feature that can compensate for inaccurate data. Foster the culture of always feeding clean data into the system among everyone in the business.
Identify the Users
The users can either be consumers or creators. The creators need to formulate reports and dashboards while consumers can only read/run reports and dashboards. This identification determines the permission given to each user.
Folder Management
Though it might seem trivial, when handled correctly at the beginning management of reports become scalable. An example of folder management can be by role, location or function.
Approaches to User Permissions
Two main approaches can be used to grant permission. The first is by granting permission for everyone to create and make changes on the dashboard. The second approach is to allow only a specific group of people to create and make changes. The rest can only read the reports.

Control Report Types
Not all report types are relevant for the business. Therefore, there is a need to hide report types which are not needed by the business to avoid unnecessary confusion.
Tell a Story on the Dashboard
The information on the dashboard should be easy for its users to process.
Use Dynamic Dashboards and Filters as Necessary
Filters allow users access only what they need from the dashboard. Dynamic dashboards are structured for specific users.
Roll Out the Management Report System
Consider how the reports can be made mobile and accessible in small digital devices. Using deeplink on dashboards makes it possible to link the users remotely.
Provide Embedded Charts
Embedded charts on the reports provide real time context to the information in the report.
Mass Delete
This is used to delete old reports which are not important to the users and have not been run over a long period of time.
What are Examples of Management Reports?
Management reports serve different purposes and are of different types. Below are some examples of the basic types of management reports.
External Reports
As is suggested by the name, these reports are aimed at peripheral stakeholders to the business, for instance, customers, suppliers, investors and others. The reports can also be beneficial in providing a perspective of events that affect business from the outside, like business trends in a particular sector.

Internal Reports
the internal reports are concerned with managerial functions. Any activities that are performed at managerial levels need to be reported on. The reports do not have a particular legal guideline to be followed. The internal reports can be used at any managerial level and their intensity and frequency is determined by their main aim.
Progress Reports
These are managerial report that assesses the status of projects, giving detailed information about it. Using this report type is important as it provides the information related to the project, like the activities taking place, the deadlines, the targets, and schedules.
Operational Reports
As its name suggests, operational reports trails all the features related to the operations of a metric. The report determines how different metrics perform. These reports can be formulated every day, week or month. Their purpose is to get the best out of business processes, reduce costs, determine trends and generally enhance the daily activities of a business.
Analytical Reports
The analysis of both qualitative and quantitative data is involved. The analysis is done in order to assess the performance of the strategies used by a business. These reports convey trends and forecasts which are necessary for innovation and decision making processes.
AI-Enhanced Management Reporting
 Artificial intelligence is reshaping how organizations create, consume, and act on management reports. Traditional
reporting
relies on periodic updates, manual interpretation, and static visuals, but modern management teams need faster
insight cycles,
proactive alerts, and deeper context. AI augments management reporting by analyzing patterns, detecting anomalies,
forecasting
future outcomes, and generating narrative explanations that help executives understand what is happening and why
it matters.
Artificial intelligence is reshaping how organizations create, consume, and act on management reports. Traditional
reporting
relies on periodic updates, manual interpretation, and static visuals, but modern management teams need faster
insight cycles,
proactive alerts, and deeper context. AI augments management reporting by analyzing patterns, detecting anomalies,
forecasting
future outcomes, and generating narrative explanations that help executives understand what is happening and why
it matters.
When integrated into a web-based reporting environment, AI becomes a continuous intelligence layer that monitors data across departments, identifies emerging risks, and highlights opportunities for improvement. Instead of waiting for analysts to manually compile findings, AI-driven management reports surface insights automatically, reducing decision latency and improving organizational agility.
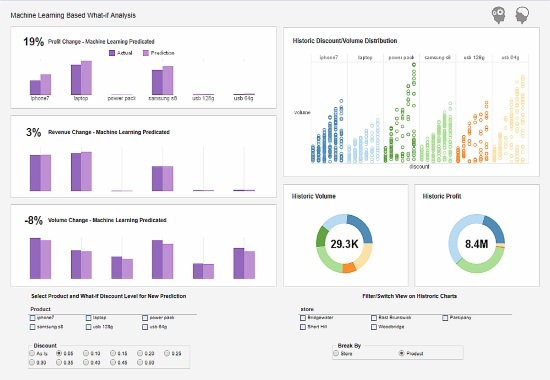
AI-Driven KPI Forecasting
Forecasting is one of the most valuable applications of AI in management reporting. Machine learning models can analyze historical performance, seasonality, external drivers, and nonlinear relationships to produce more accurate predictions for key KPIs. These forecasts help managers anticipate demand, allocate resources, plan budgets, and identify potential bottlenecks before they occur.
In a management report, AI-generated forecasts can be displayed alongside historical data, allowing leaders to compare past performance with projected outcomes. This supports more informed planning and helps organizations respond proactively rather than reactively.
Automated Insight Summaries
AI can generate narrative summaries that explain the most important changes in the data. These summaries highlight trends, exceptions, and correlations that may not be immediately obvious from charts alone. For example, an AI-generated insight might note that “Customer churn increased by 8% this quarter, primarily driven by lower retention in the enterprise segment,” and then link to supporting visuals.
Automated narratives make management reports easier to interpret, especially for executives who need a clear, concise overview before diving into detailed analysis. They also help ensure that critical insights are not overlooked.
AI-Based Anomaly Detection
Anomaly detection models learn normal patterns of behavior across operational, financial, and customer metrics. When a KPI deviates significantly from expected behavior, the system can flag the anomaly and provide context about similar past events. This is especially useful for management reports that monitor production output, revenue fluctuations, cost overruns, or service-level performance.
By surfacing anomalies automatically, AI helps managers identify issues earlier and take corrective action before they escalate. This reduces risk and improves operational stability across the organization.
Natural Language Querying
Natural language querying allows managers to ask questions in plain language and receive answers in the form of charts, tables, or narrative explanations. Instead of navigating filters or complex interfaces, users can simply type questions such as “Show monthly revenue by region” or “Which cost centers exceeded budget this quarter?”
This capability makes management reporting more accessible to non-technical users and encourages broader adoption of analytics across leadership teams.
AI-Assisted Data Preparation
Behind every management report is a data model that defines relationships, hierarchies, and business logic. AI can assist in building these models by detecting joins, identifying data quality issues, and recommending transformations. This reduces the time required to prepare data for reporting and helps maintain consistency across departments.
AI-assisted data preparation is especially valuable for organizations that manage large volumes of data from multiple systems. It ensures that management reports are built on clean, reliable, and well-structured information.
Intelligent Alert Prioritization
Management reports often include alerts for threshold breaches, KPI drops, or operational issues. AI can prioritize these alerts based on historical impact, current context, and user preferences. High-risk alerts can be escalated, while low-impact alerts can be grouped or deprioritized.
This prevents managers from being overwhelmed by notifications and ensures that the most important issues receive immediate attention.
Embedding AI into Management Workflows
AI capabilities can be embedded directly into management dashboards, departmental portals, and operational workflows. For example, a production manager might receive predictive maintenance recommendations based on sensor data, while a finance director might see risk scores for cost centers trending above budget.
Because AI operates continuously, these insights appear automatically as part of the management reporting cycle, helping leaders make faster and more informed decisions.

Building a Future-Ready Reporting Strategy
AI is becoming a core expectation in modern management reporting. Organizations that adopt AI-driven forecasting, anomaly detection, natural language querying, and automated narratives gain a significant advantage in speed, accuracy, and strategic clarity. By integrating AI into management reports, leaders can shift from reactive reporting to proactive, intelligence-driven decision-making.
Whether monitoring performance, planning budgets, or evaluating risks, AI-enhanced management reports provide the insight layer that modern organizations need to operate efficiently and competitively.
Preparing a Management Report
How do you present a management report?
In order to summarize the major steps which have been investigated in this article and strengthen the understanding of the meaning of management report, a list of 20 fundamental guidelines used in creating excellent reports have been given. Taking the initiative to be aware of these guidelines enhances an individual's business intelligence
Setting the Strategic Goals and Objectives
The initial step is to describe the end result, the reason why the report is needed and the audience of the report.
Select the Appropriate KPIs for the Audience
Every management level has unique and specific needs.
Consider Customer Feedback
The strength of a business is its customer base and thus a focus on customer satisfaction is integral.
Enhance the Data Storytelling Proficiency
Having collected data, making it understandable for everyone is possible through a good story, supported with a wide-ranging dashboard.
Enhance Visualization Through Focus
BI software makes it possible to formulate a convincing dashboard within a short time, which helps in conveying information.
Consider Human Intuition in Your Visuals
Human intuition is important in making the visuals more appealing to the users.
Promote Clarity
It is safe to follow some guiding principles when elaborating report findings in order to retain precision.
Digitalize
Online dashboards allow the reports to have merged information that is interactive and real time.
Strike a Balance
To get the optimal benefit from digital dashboards, the visualizations used need to complement each other so as to avoid confusing the audience. The important information needs also to be consolidated on a single page.
Utilize Multidimensional Charting
Consider the rule of thumb which advises on use of one or two more dimensions, to prevent creation of charts which are difficult to interpret.
Make the Report Scannable and Drillable
Using filters to enhance scanability and drill boxes to attain further information.

Have Relevant Real-time Data
In as much as real time data is priceless for any business, the data needs to be aligned with the general goals. Testing the reports before making them available for everyone allows for a chance to improve on relevance and clarity.
Continual Growth
Growth and change is inevitable for a sustainable business. Therefore, relentless testing helps get rid of redundancy and inefficiency.
Employ Predictive Analytics & AI
Advanced analytic tools are available for businesses to use in order to get the best from their reports. These tools pick up on trends and create patterns for possible future trends.
Encourage Collaboration
Working as a team brings more important ideas which are valuable for the report, making it sustainable.
Build a Sense of Cohesion & Consistency
Both the visuals and the KPIs need to be united and consistent in order to create a harmonious report which is successful.

Classify the Data Efficiently
Together with creating unity in the single page layout on the dashboard, it is also necessary to categorize the data on the page so as to make access easy.
Generate a Scannable Timeline
An informational timeline that has been created over a given period of time makes it manageable to form strategies in different key sectors.
Apply Self-Service Analytics
All the employees need to be involved in the process of reporting as they are supported by self service analytics.
Promote Data-Driven Culture
Culture of a company informs the way it carries out its activities, relates with customers, handles change initiatives, and addresses customer complaints. Pushing the company to adopt a data driven reporting process helps everyone embrace the idea, boosting the use of the dashboards by everyone.
All the insights given in this article help the formulation of an online reporting system that the business leaders can use to make efficient data based decisions.

Management Reporting FAQs
What is the purpose of a management report?
A management report provides decision-makers with a clear, structured view of performance, risks, and opportunities. Its purpose is to help leaders understand what is happening, why it is happening, and what actions should be taken next. Modern reports often include AI-driven insights such as forecasting and anomaly detection to support faster, more proactive decisions.
What should a management report include?
A well-designed management report includes key performance indicators, trend analysis, exceptions, narrative explanations, and recommended actions. It should highlight what changed, why it changed, and what decisions need attention. Adding AI-generated summaries or predictive insights can make reports more actionable and easier to interpret.
How often should management reports be updated?
Most organizations update management reports monthly or quarterly, but operational teams may require weekly or even daily updates. With modern BI platforms, real-time dashboards can complement periodic reports by providing continuous visibility into critical KPIs.
What KPIs belong in a management report?
KPIs should align with strategic goals and departmental priorities. Common categories include financial KPIs, operational KPIs, customer KPIs, and risk KPIs. A structured KPI selection framework helps ensure reports stay focused and relevant. You can expand this with a dedicated KPI guide.

How do dashboards differ from management reports?
Dashboards are interactive, real-time, and operational, while management reports are periodic, narrative, and strategic. Dashboards help teams monitor ongoing performance, whereas reports help executives evaluate results, identify trends, and make higher-level decisions. A comparison section can be added using dashboard vs report guidance.
How can AI improve management reporting?
AI enhances management reporting by detecting anomalies, forecasting future outcomes, generating narrative summaries, and prioritizing alerts. These capabilities reduce manual analysis and help leaders focus on decisions rather than data interpretation. You can expand this with a full AI section.
What visuals work best in management reports?
Effective visuals include trend charts, KPI tiles, variance indicators, heatmaps, and exception highlights. Visuals should reinforce the narrative and make it easy to identify what requires attention. A design-pattern section can be added using interactive report design patterns.
How do I make management reports easier for executives to read?
Use concise narratives, clear KPI groupings, consistent layouts, and action-oriented summaries. Executives benefit from reports that tell a story rather than simply present data. A storytelling framework can be added using executive storytelling guidance.
Can management reports be automated?
Yes. Modern BI platforms allow automated data refreshes, scheduled report delivery, AI-driven alerts, and automated narratives. Automation reduces manual effort and ensures leaders always have up-to-date information.
How do embedded management reports work?
Embedded reports allow organizations to place dashboards and management views directly inside portals, SaaS applications, and internal systems. This gives stakeholders access to insights without switching tools. You can expand this with embedded reporting guidance.