Report Tools Definition
The Development of Report Tools
Report tools, also called reporting software, are applications that provide enterprises with various reports about their businesses. Reports produced can range from sales reports, to production reports, to ad hoc reports, reports in which the user customizes the queries, perhaps for a specific problem.
Primarily, report tools hub essential data from every corner of the enterprise, and then present the data in a meaningful way to employees and decision makers.
Predating automated reporting systems, reports had to be put together by hand from many different spreadsheets and only a handful of people would be able to view the data. This process was time consuming, vulnerable to error, and created a bottleneck effect of information flow within the enterprise.
Today, however, report tools have become increasingly indispensable in the business environment. Such tools allow essential and relevant data to stream through all levels of the enterprise in real time. Furthermore, the data is no longer just numbers, but rather a live visual of where the business stands.


The Benefits of Good Report Tools
Report tools enable employees and decision makers to conceive the true standing of their business in the current market. Report tools allow all users to interact with the data that is most important to them and the enterprise, especially when making vital business decisions. By these means, each department and enterprise as a whole, may become more effective by utilizing real time data.
There are many reasons to love the data provided by report tools:
- Strategize future plans and become more competitive in the market
- Build "what-if" scenarios
- Make sound decisions based on real time information
- Gauge the health of your business
- Share essential information with all levels of the enterprise
Report tools also have the ability to be customized for specific needs:
- Generate reports using the data you want
- Format reports the way you want them to look
- Interact with up-to-the-minute information
- Reshape reports in real time
- Minimize performance bottlenecks
Accessibility of Good Report Tools
Advanced reporting tool software is easy to use. For instance, report templates can be re-used, which saves structuring and formatting time for the user. There are lots of templates to choose from, giving the user design and presentation freedom for each report while alleviating menial decision making. The user may also choose the data relevant to the report they want to create, allowing for specific and customized reports. Sharing information within the enterprise becomes easier and quicker.
- Users can generate and analyze reports without IT help
- All personnel can view business challenges on screen and diagnose in real time
- Reports become an internally shared and trusted measurement, so business is more consistent
Business Reports Bottom Line
Report tools become a channel to not only view and run your business, but also to control it. Specifically, such tools deliver a vision of the current position of your business and serve as insight for the next key steps. In fact, a strong report tool can be the difference between the success or failure of an enterprise
Take away: Use report tools to understand and strategically evolve your business.

Free Reporting Tools for Excel Data
There are three free reporting tools for Excel data to suggest. All of them are cloud-based, meaning there is no software to download.
1. The first is Visualize Free. Register any address. Upload your spreadsheet from any Microsoft version and use the drag and drop designer to create interactive and paginated reports. It is best for ad hoc or one-time report projects.
2. The second is the InetSoft Individual Account. Register with any email address, including free email services such as Google and Yahoo. There is no credit card required. Use the 100% web app with no desktop install. Collaborate online in real time. Use data sources such as uploaded Excel or CSV files or connect to live Google sheets. Publicly share dashboards, if you wish, via URL link. All advanced chart types and interactive report exploration controls are available.
3. The third is the InetSoft Business Account, Register with any organizational (business, university, or organization) email address. No credit card is required. Access more data sources such as uploaded Excel or CSV files or connect to live Google sheets, plus more Google apps, Facebook, and many other online data sources. Publicly share dashboards, if you wish, via a URL link. Privately share dashboards and analyses within your organization (as long as people use the same email domain). All advanced chart types and interactive report navigation controls are available.
Open Source Reporting Tools
What about open source reporting tools? Aren't they free?
Well, yes, except you might be disappointed by the lack of features and technical support which are reserved for their commercial versions. The two to suggest trying are BIRT and FineReport.
Google Analytics Report Tool
InetSoft offers a Google Analytics report tool. The commerical enterprise reporting platform can connect to Google Analytics, and with an easy-to-learn designer, you can develop much more useful charts and data visualizations than are possible with Google's rudimentary charts and reports.
Sort and filter on as many fields as you wish instead of being constrained to having to choose one sort and filter at a time. Additionally you can mash up your web traffic data with any other data you may have in your organization to calculate all your required KPIs and to get a 360 degree of marketing performance
What Are the Types of Reports in Business Intelligence
1. Production Reports
Production reports are paginated PDF or web-based reports that are automatically emailed to distribution lists. They could be automatically scheduled to be sent on daily, weekly, or monthly bases. They could be customized to each recipient showing only information that is relevant or permitted to them using a technique called bursting. They are intended to give managers and executives a combination of summary and detailed views of activity or peformance. To learn more see https://www.inetsoft.com/company/interactive_production_reports/
2. Ad Hoc Reports
An ad hoc report gives a users a wizard to filter on fields like date range, categories, and status in order to generate a new report on demand in summary and detailed layouts. A staff person could use such a report to find the day's action items to work on, for instance. To learn more see https://www.inetsoft.com/info/ad_hoc_report_definition/
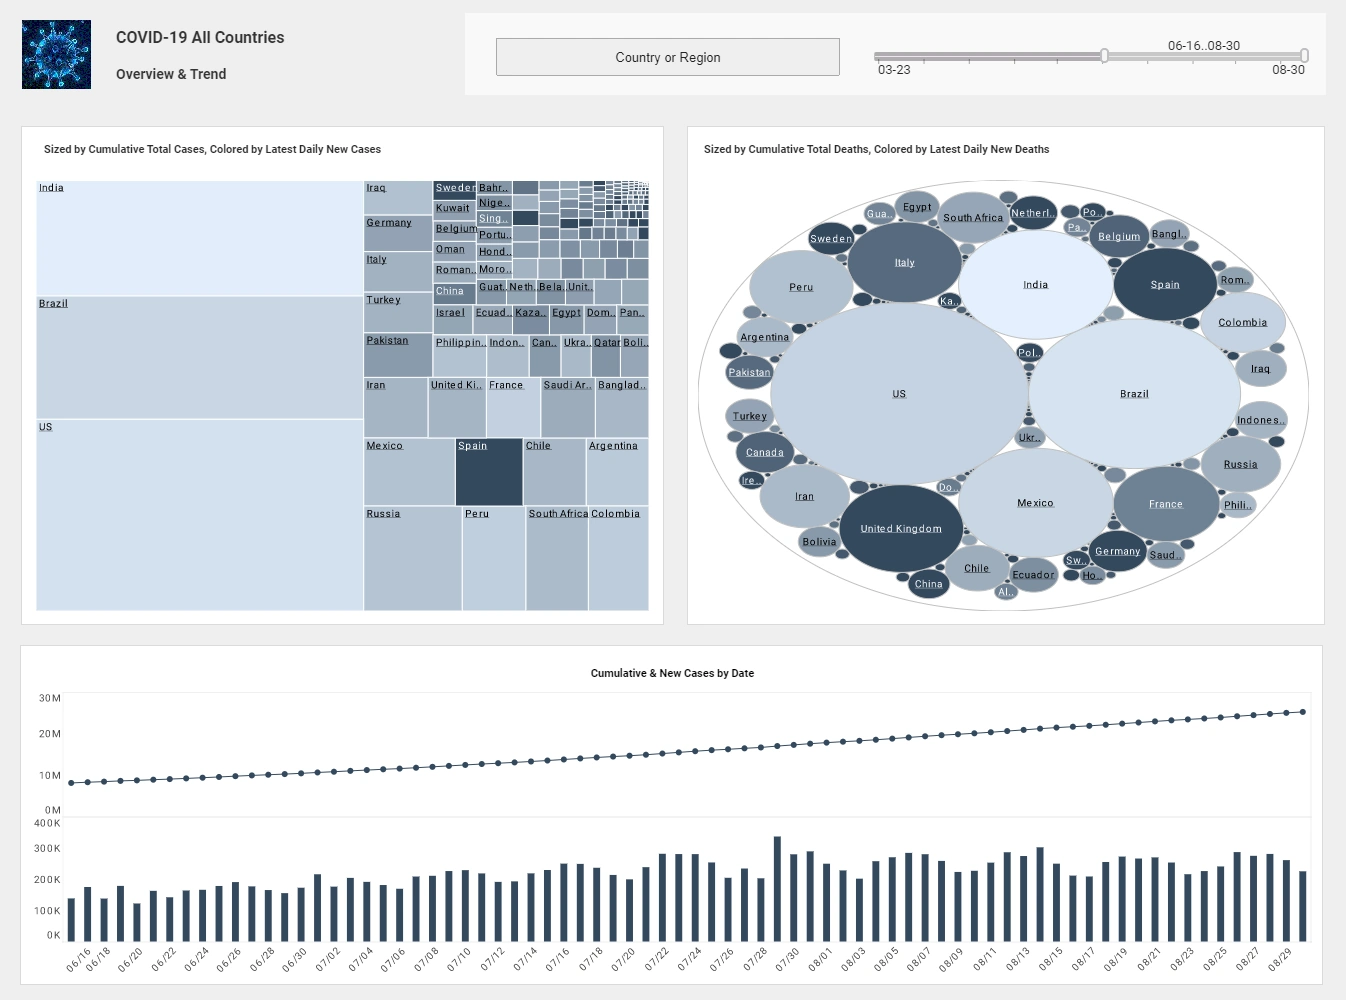
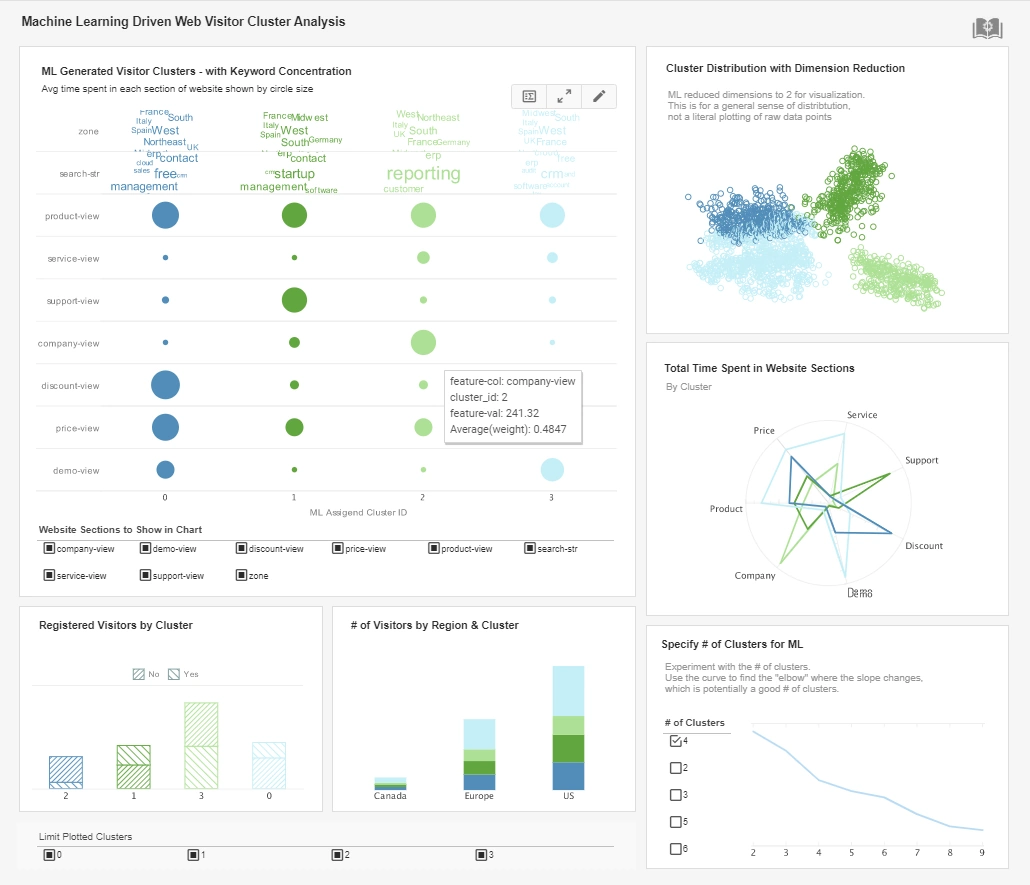
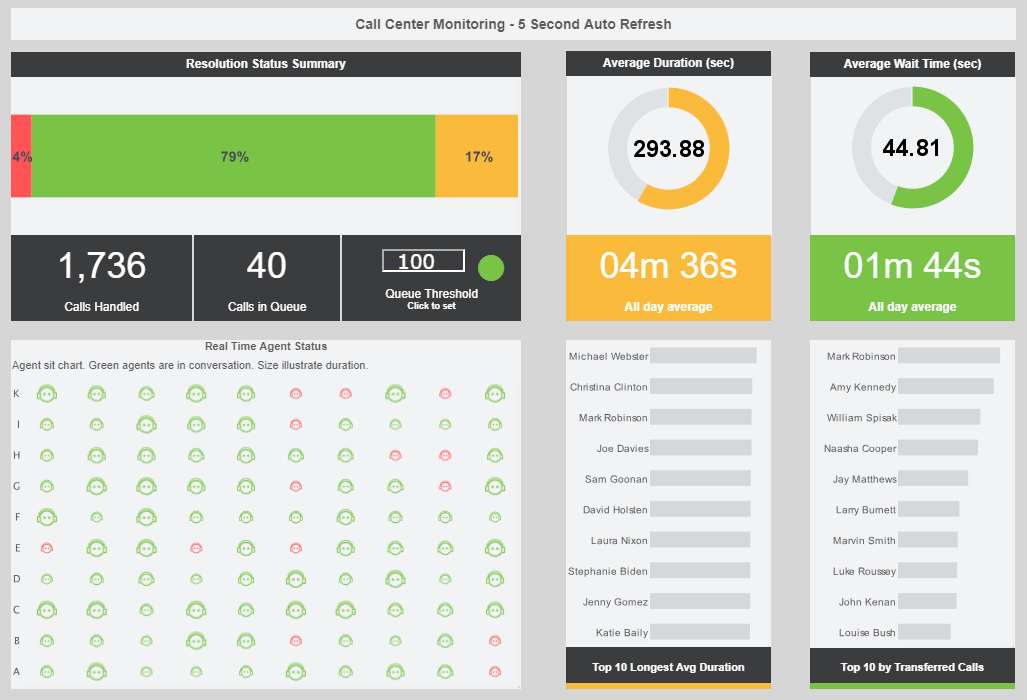
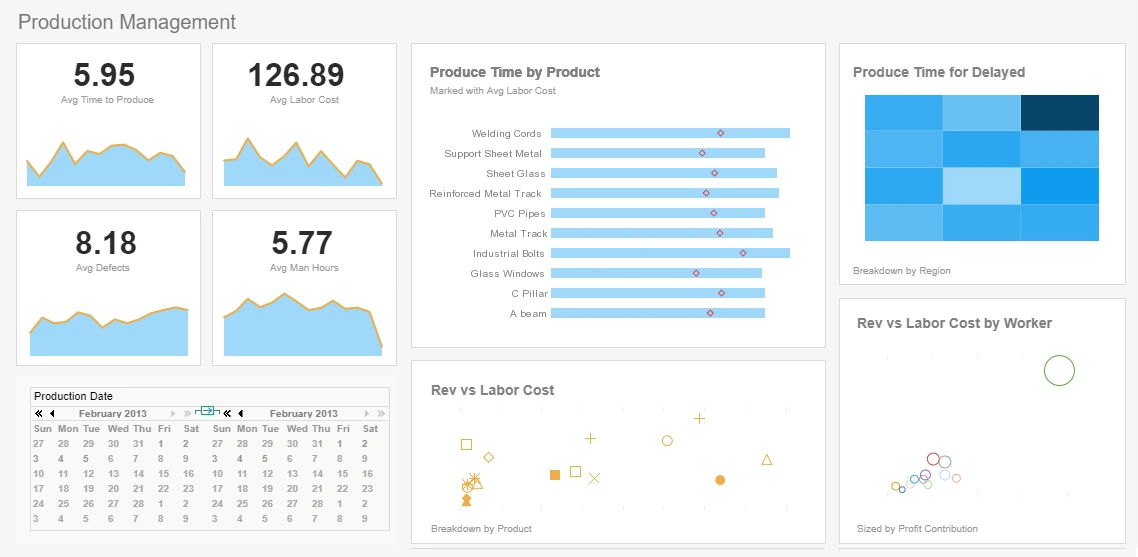
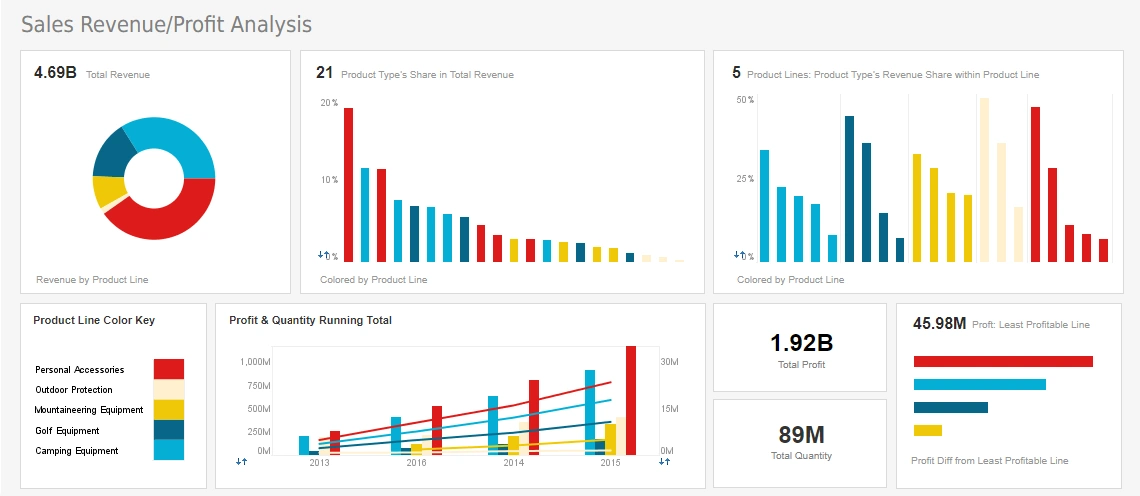
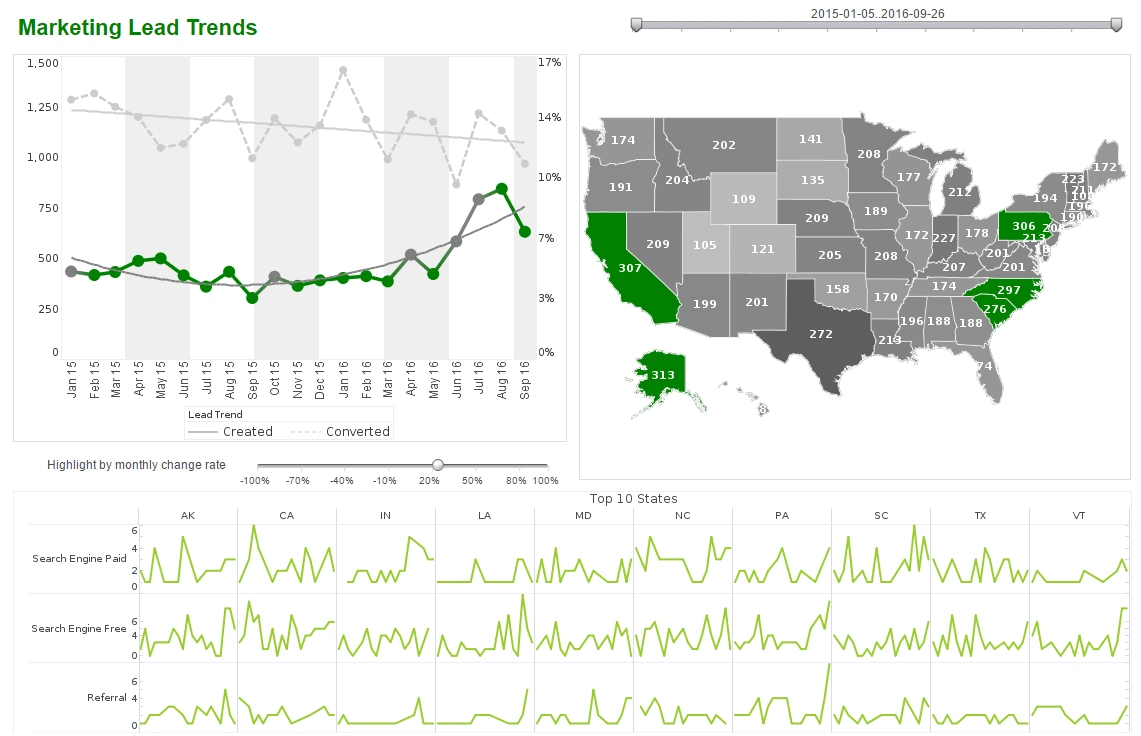
3. Dashboard Reports
Dashboard reports are web-based, interactive displays of information containing multiple charts and tables. They allow a great deal of self-service and data exploration as users can choose the view of the data with simple mouse clicks. Users can drill-down and zoom in data of interest. Advanced data visualization techniques make finding problem areas, outliers, trends, correlations, and opportunities much easier than traditional reports.To learn more see https://www.inetsoft.com/company/dashboard_reporting/

Is Excel a Reporting Tool?
No, Excel is not a reporting tool. It is an information management tool that can be used as a manually updated datamart and for doing ad hoc analysis and charting. It doesn't enable any of the 3 main business intelligence report types: production reports, ad hoc reports, or dashboard reports.
Is SQL a Reporting Tool?
No, SQL is not a reporting tool. It is a database querying language often used to generate reports. Modern reporting systems generate SQL in the background after a user or developer has used a graphical report designer to assemble a report.
Is Jira a Reporting Tool?
No, Jira is not a reporting tool. It's a specialized application and database for managing software development project management information. It has built-in reporting capabilities to show charts and tables of things like outstanding issues, progress, and trouble tickets. However, it cannot generate reports on information not in its specialized database.

What Are the 2 Types of Report Tools?
There are two main types of reporting tools: data visualization tools and analytical tools. Data visualization tools help users visualize large amounts of information by creating visual representations of data. Analytical tools allow users to analyze data and create reports based on the results. Ideally the report tool you choose includes both of these types in one solution.