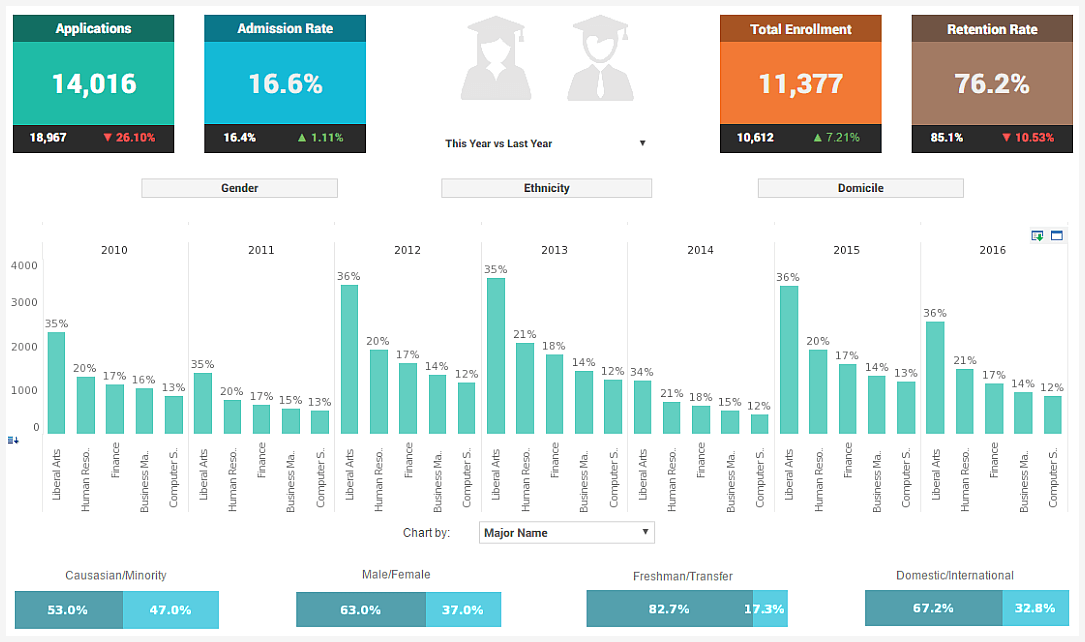
Evaluate Dashboard Builder Tool
InetSoft's dashboard builder tool, StyleBI, is an essential element of running an effective business. It allows users to monitor various different aspects of a business in order to judge its health. The tool can also be used to forecast future business results or customer behaviors.
A proper dashboard building tool fundamentally converts unattractive spreadsheets into palatable displays of information. StyleBI accomplishes this with charts, reports, heat maps, graphs, and a variety of other visual data tools.
StyleBI features a user interface that allows its consumers to create engaging dashboards within minutes. With other software, this process can take hours, possibly even days. With the InetSoft application, however, users can drag-and-drop information with a few button clicks and literally no coding knowledge to create professional displays.
These displays can then be shared with just about anyone. StyleBI is a zero-client dashboard building tool and will run on just about anything with a Web browser, including mobile iDevices.
Why StyleBI is a Powerful Dashboard Builder for Salesforce Users
Salesforce is widely regarded as one of the most effective Customer Relationship Management (CRM) platforms available today. Its native dashboard capabilities are helpful for tracking leads, opportunities, and sales activities. However, Salesforce’s built-in reporting tools have limitations when it comes to advanced visualization, cross-platform data integration, deep customization, and real-time analytics. This is where StyleBI emerges as a game-changing solution. It complements Salesforce by providing highly customizable dashboards, broader data connectivity, and enterprise-grade analytics capabilities, enabling users to drive better decisions and performance across sales, marketing, and service departments.
Benefits of Using StyleBI with Salesforce
1. Advanced Data Blending and External Integration
One of the key limitations of Salesforce dashboards is their restricted ability to incorporate data from external systems such as marketing platforms (e.g., Google Ads, Mailchimp), financial systems (e.g., QuickBooks, NetSuite), or supply chain databases. StyleBI enables seamless integration with multiple data sources in real-time. This allows organizations to create holistic dashboards that not only show CRM performance but also relate it to spend, pipeline velocity, channel efficiency, or service SLAs.
2. Real-Time, Streaming Dashboards
Salesforce reports are often limited to scheduled refreshes or require manual updates. In contrast, StyleBI supports real-time data streaming and in-memory computing. Sales managers can instantly see updates as leads progress, quotas are met, or deals close—without waiting for batch jobs or static report refreshes.
3. Deep Customization and Layout Freedom
Salesforce dashboards enforce strict layout structures and standard visualizations such as bar, line, and pie charts. StyleBI provides pixel-perfect layout capabilities, advanced visual elements like heatmaps, bullet charts, scatter plots, radar charts, and custom icons. Sales leaders can fully customize how each metric appears, arrange visual elements in full-screen landscape mode for team presentations, or design mobile-optimized layouts for sales reps on the go.
4. AI-Powered Insights and Predictive Analytics
While Salesforce Einstein offers predictive capabilities, it is limited to users in higher-tier licenses and specific use cases. With StyleBI, AI algorithms can be trained on historical sales performance, conversion behavior, and customer segmentation data from any source—not just Salesforce. Sales teams can deploy predictive scoring models, churn forecasting, and next-best-action recommendations inside a unified dashboard.
5. White-Labeled Embedded Analytics
Salesforce dashboards cannot be easily embedded into external portals or partner platforms. StyleBI offers complete white-labeling and embedding options. Sales operations teams can embed dashboards in dealer portals, partner ecosystems, or client-facing SaaS platforms with their own branding. This makes it possible to share relevant KPIs with external stakeholders without providing access to Salesforce itself.
6. Multi-Tenant Dashboard Management
For businesses serving multiple clients, franchises, or sales territories, StyleBI supports multi-tenant configurations with shared and segmented data views. A single dashboard template can serve hundreds of territories while restricting each manager’s access to only their relevant data. Salesforce’s dashboard capabilities cannot scale as efficiently across tenants without duplicating reports.
Example of an Advanced Dashboard Built with StyleBI (Not Possible in Salesforce)
Imagine a regional sales director wants to track campaign ROI, quota attainment, lead velocity, and sales enablement effectiveness across five channels (email, phone, social, events, referrals). In Salesforce, visualizing this requires multiple dashboards, limited data types, and lacks external campaign data.
Using StyleBI, a unified and interactive dashboard could include:
- Bullet Charts showing sales reps’ quota performance vs. monthly targets
- Heatmaps to visualize geographic lead density and conversion rates by zip code
- Scatter Charts comparing campaign cost vs. pipeline value across channels
- Multi-source integration combining Salesforce leads, HubSpot campaigns, and Google Ads spend
- Drill-down capability from region-level metrics to individual rep performance in real-time
- Predictive model output showing likelihood of lead conversion based on AI scoring
- Mobile-responsiveness allowing the dashboard to be accessed on tablets or phones during field visits
- Self-service filters for managers to adjust date ranges, product lines, or regions on the fly
Such a dashboard provides instant insight into how specific campaigns are influencing the sales pipeline while allowing real-time coaching and territory management. Building this level of visualization in Salesforce would be extremely difficult, especially across multiple external data sources and visual complexity.
How Sales Teams Benefit Directly
Sales professionals live in a fast-paced environment where time-to-insight is critical. StyleBI dashboards empower salespeople and managers to:
- Monitor lead progression and performance KPIs without toggling between tools
- Understand the full funnel impact of multi-channel campaigns in one view
- Collaborate across departments using shared, real-time dashboards
- Act on predictive alerts to prevent deal slippage or customer churn
- Customize views according to role, team, or territory to drive accountability
Low Code, High Agility
StyleBI’s visual development environment enables analysts and business users to create complex dashboards with minimal code. For Salesforce admins or analysts already familiar with CRM objects, designing a dashboard using drag-and-drop builders, formulas, and scripting tools becomes intuitive. This agility reduces IT backlog, shortens deployment cycles, and enables faster iteration.

