Information about Software for Reports: Why Use InetSoft?
 "Would my company really benefit from reporting
software?"
If your company has data (customer information, sales figures, inventory levels, etc.), then the short answer is yes, there are major benefits to having reporting software. Market driven companies use data to get a better understanding of the competition, their customers, and their own performance.
But raw data is not as useful to businesses on its own. In order for business users to understand, interpret, and make informed decisions, all that data needs to be transformed into a more user friendly format. Reporting software is a business tool that transforms raw data into meaningful information.
 "That's fine, but how does reporting software
work?"
A company's data is housed in databases and data warehouses. Databases are typically smaller and are designed to record data. Data warehouses can be more complex and are designed to respond to user queries. Queries are requests for data and can be simple, net sales for example, or much more sophisticated, such as the proportion of net sales attributable to running a promotion on a single product line.
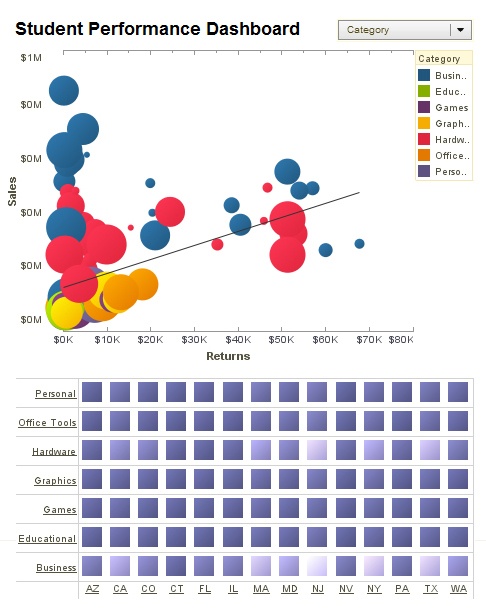
Once set-up, reporting software connects to your multiple data sources, fetches data based on user submitted queries, and displays the information in easy to interpret charts, graphs, and visualizations. However, not all reporting software solutions are made equal. Individual database connectivity, data mining technology, and types of visualizations vary from product to product.
It is important to choose a reporting software solution that can connect to multiple data sources, has sophisticated data mashup and drill down functionality, and can render compelling and intuitive visualizations.

 "What are some examples of reporting software in
action?"
- Turn raw sales data into user friendly Top 10 lists based on: product lines, sales people, departments,
regions, sales periods, etc.
- View year end data in terms of: last year's performance versus this year's, size of the current sales
pipeline versus the same period last year, dollar-sizes of all opportunities in the sales pipeline by sales
stage, number of new leads created by month, and more.
- Get a detailed analysis of your supply chain by transforming operations datasets into meaningful reports displaying KPIs, like: average lead time to fill an order, number of open cases by status, overall case open versus close rate, and more.
 "What makes InetSoft's solution so
special?"
InetSoft makes reporting software that is easy to deploy and easy to use, and its unique data mashup capabilities enable unified views of organizational performance and maximum self-service.
InetSoft's small-footprint, Web-based application provides a streamlined, intuitive interface for all users. As an innovator in reporting software since 1996, InetSoft has pioneered the evolution from static reporting towards interactive visualization of data via dashboards.
| More: Interactive Forms in a Report |
More: Enterprise Reporting
|