InetSoft Product Information: Java Reporting
This is a table of contents of useful reporting dashboard information related to InetSoft's Style Report Enterprise. Its features are included in InetSoft's flagship business intelligence software for dashboards, reporting, and analytics - StyleBI:
Report Scorecard Targets - Report scorecard targets allow users to effectively handle and discern key metrics through InetSoft's visually driven reporting software. View the information below to learn more about the StyleBI solution. A scorecard consists of one or more targets. 'Target' is the collective name given to a metric, its trigger, and the data condition. A Target facilitates the management and evaluation of a metric. To create a Target, follow these steps. 1. Select the Scorecard tab, click on the 'New' link below the scorecard object tree, and select the 'Target' option, or select an existing target for editing under the 'Targets' node. 2. Type in a suitable name and description. 3. Select the Metric tab below the editing panel and choose a metric from the list of available options...
 |
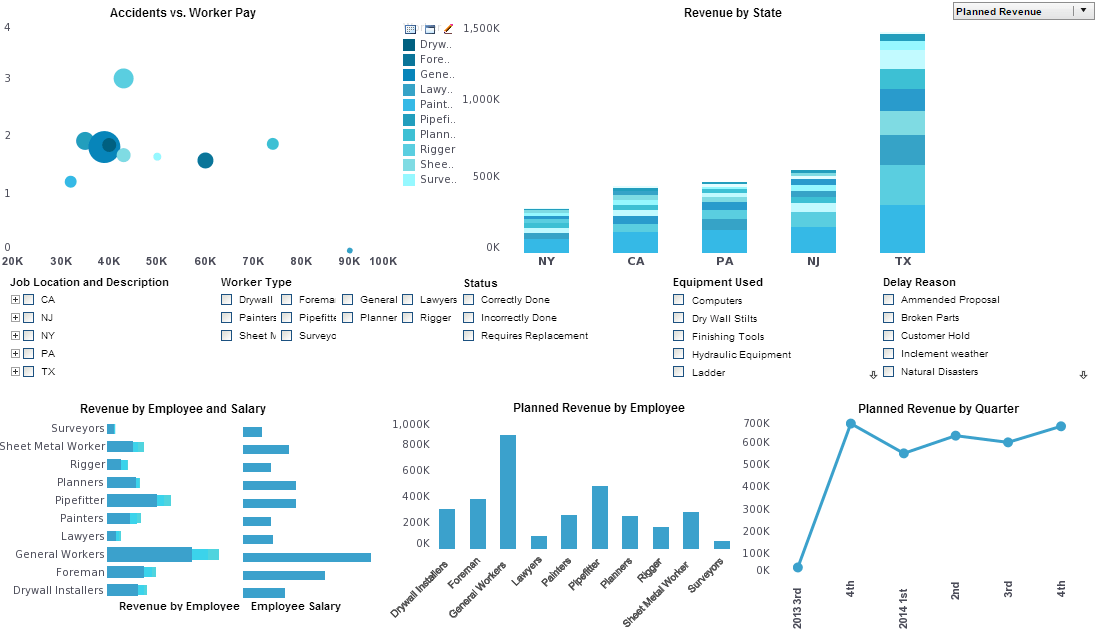
Click this screenshot to view a three-minute demo and get an overview of what
InetSoft’s BI dashboard reporting software, StyleBI, can do and how easy it is to
use.
|
Report Script - Learn how to use InetSoft's report script language to control report and chart creation in your Web application. View a demo and download a free eval copy. DataSet.getRowCount() Returns the number of rows in the DataSet (including the header row). DataSet.getColCount() Returns the number of columns in the DataSet. DataSet.setOrder(dim,arr) Set a manual label ordering for a given dimension field...
Report Scripting - Creating Charts - Charts display grouped and aggregated data in a graphical manner. The 'Properties' and 'Data Binding' dialog boxes for Charts provide many options for customization, including style, formatting, axis information, ranking, sorting, and so on. All of these various options are also accessible through script. See Modifying Chart Properties and Modifying a Chart Data Binding in this section for more information. The Chart API provides access to the charting engine using Java object syntax. See Appendix CT:Chart Tutorial (API) for examples. You can additionally modify charts in an extensive manner by using Chart API commands. For example, you can add graphical shapes or arbitrary text to the plot area, and you can annotate the chart based on the data that it displays. You can also build a chart from the ground-up completely within script. See Modifying a Chart Element using API Functions and Creating a Chart Using API Functions for examples of using the Chart API. To modify the basic properties of a Chart element, simply specify the desired property value in the onLoad Handler or Element Script. The following sections provide some basic examples of property modifications...
Report Section Layout - InetSoft's reporting software gives sophisticated report section layout tools that are powerful and flexible. View the example below to learn more about the StyleBI solution. In the ‘Interactive’ report, the ‘Sales by Geography’ element is a section. You must be in Ad Hoc mode to modify a section. Right-click on the section (if you right-click on a field within the section, use the ‘Section’ sub menu) and select ‘Properties’. You can change the color, visibility, and borders for all the bands in the section. You can add new elements from the left pane by dragging them into the layout on the right. You can change the position and size of elements on the right by selecting them, then dragging the element or its resize handles. You can also modify the properties of elements in the layout by selecting them, right-clicking, and choosing ‘Properties’...
Report Sections - A report section is a container of other elements. In most cases, you add script to the individual elements within the Section, rather than to the Section element itself. However, Section scripts also have some special behaviors. When you bind a Section to a data source (i.e., to generate a pseudo-table), each band of the Section is repeated multiple times, corresponding to the number of rows returned by the query. For example, the Content band of the Section is repeated once for each detail record returned by the query. If you place a script on a component within a repeating band, this script is re-executed for every band repetition. This has the effect of wrapping the script in an implicit “for” loop. Within the script, you can reference the values of elements in the same band: • value – the value (in current band iteration) of the element to which the script is attached. Use auto-complete to enter the correct syntax. • field['column_name'] or field.column_name – the value (in current band iteration) of the element in the specified field. You can also refer to an element in the band by its Element ID (e.g., “Text1.text”) to obtain the current value. To obtain the row number corresponding to the current band iteration, use the sectionRow property...
 |
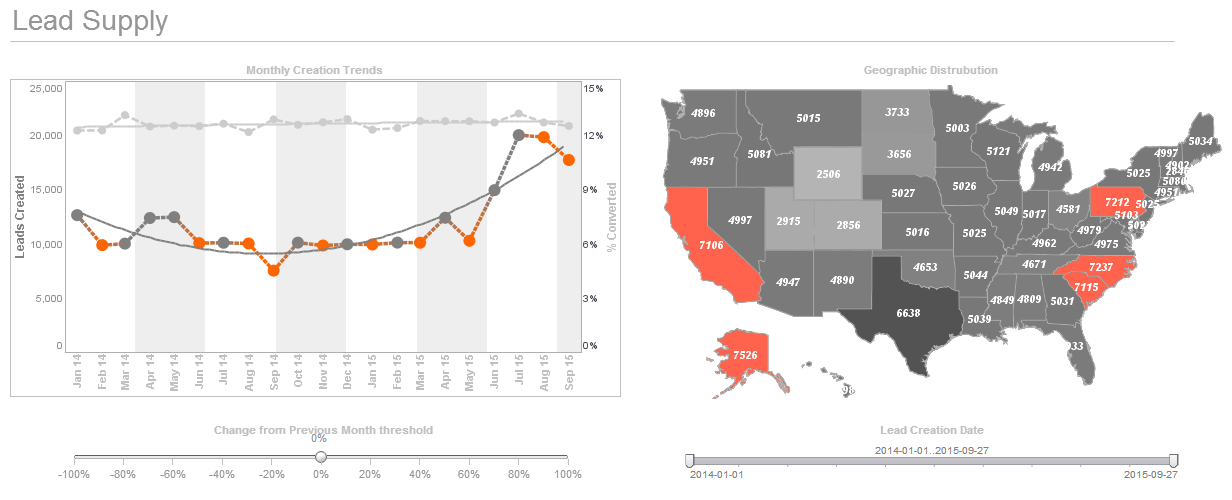
Click this screenshot to view a three-minute demo and get an overview of what
InetSoft’s BI dashboard reporting software, StyleBI, can do and how easy it is to
use.
|
Report Security - InetSoft's reporting software carries extensive report security options in order to ensure a high level of protection of proprietary information. View the information below to learn more about the StyleBI solution. Security is an important part of any enterprise application. InetSoft's security model provides security at both a component and functional level, e.g., a user is able to view a report, but is not be able to perform Ad Hoc reporting operations on it. InetSoft's security model also provides security at a very granular object level, e.g., a user who has Ad Hoc reporting permissions may not have access to all the data models or queries in the data source registry. The security model is highly adaptable and configurable, e.g., you can import your existing users/groups/roles from a database or an LDAP server without redefining them in InetSoft's software. There are two fundamental components to setting up security: (a) specifying a Security Provider and optionally defining users, groups and roles; and (b) specifying permissions for reports and other components...
| Previous: Developing Reports |