Learning about Key Performance Indicators for IT?
IT key performance indicators are metrics that are used to track an organization's technology service and support performance. InetSoft is a business intelligence software provider who makes dashboard and reporting software for tracking these KPIs, comparing actuals to forecast or target.
In general no software application is going to provide KPI's ready-to-use, since KPI's are metrics that are often derived from formulae that are specific to an enterprise in many cases, and in all cases the data that make up the KPI need to be mapped into the software application. However, InetSoft's StyleBI is designed to be as easy as possible to deploy and use.
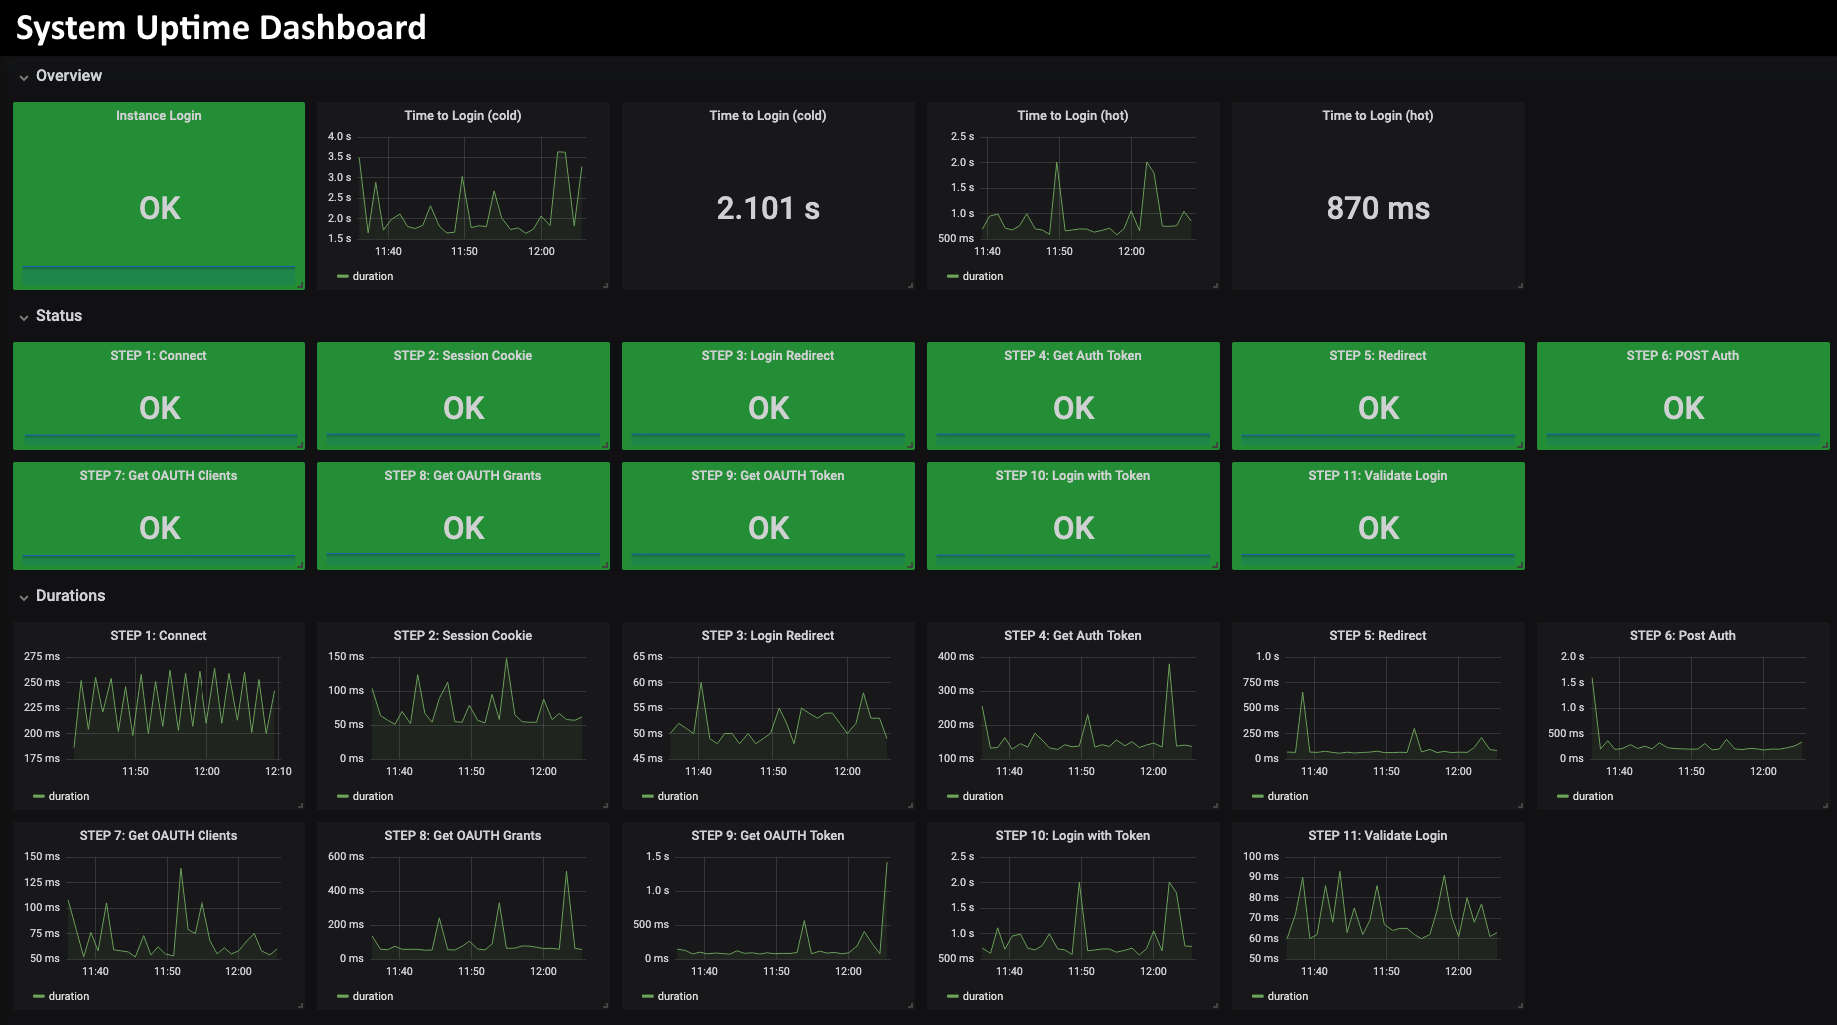
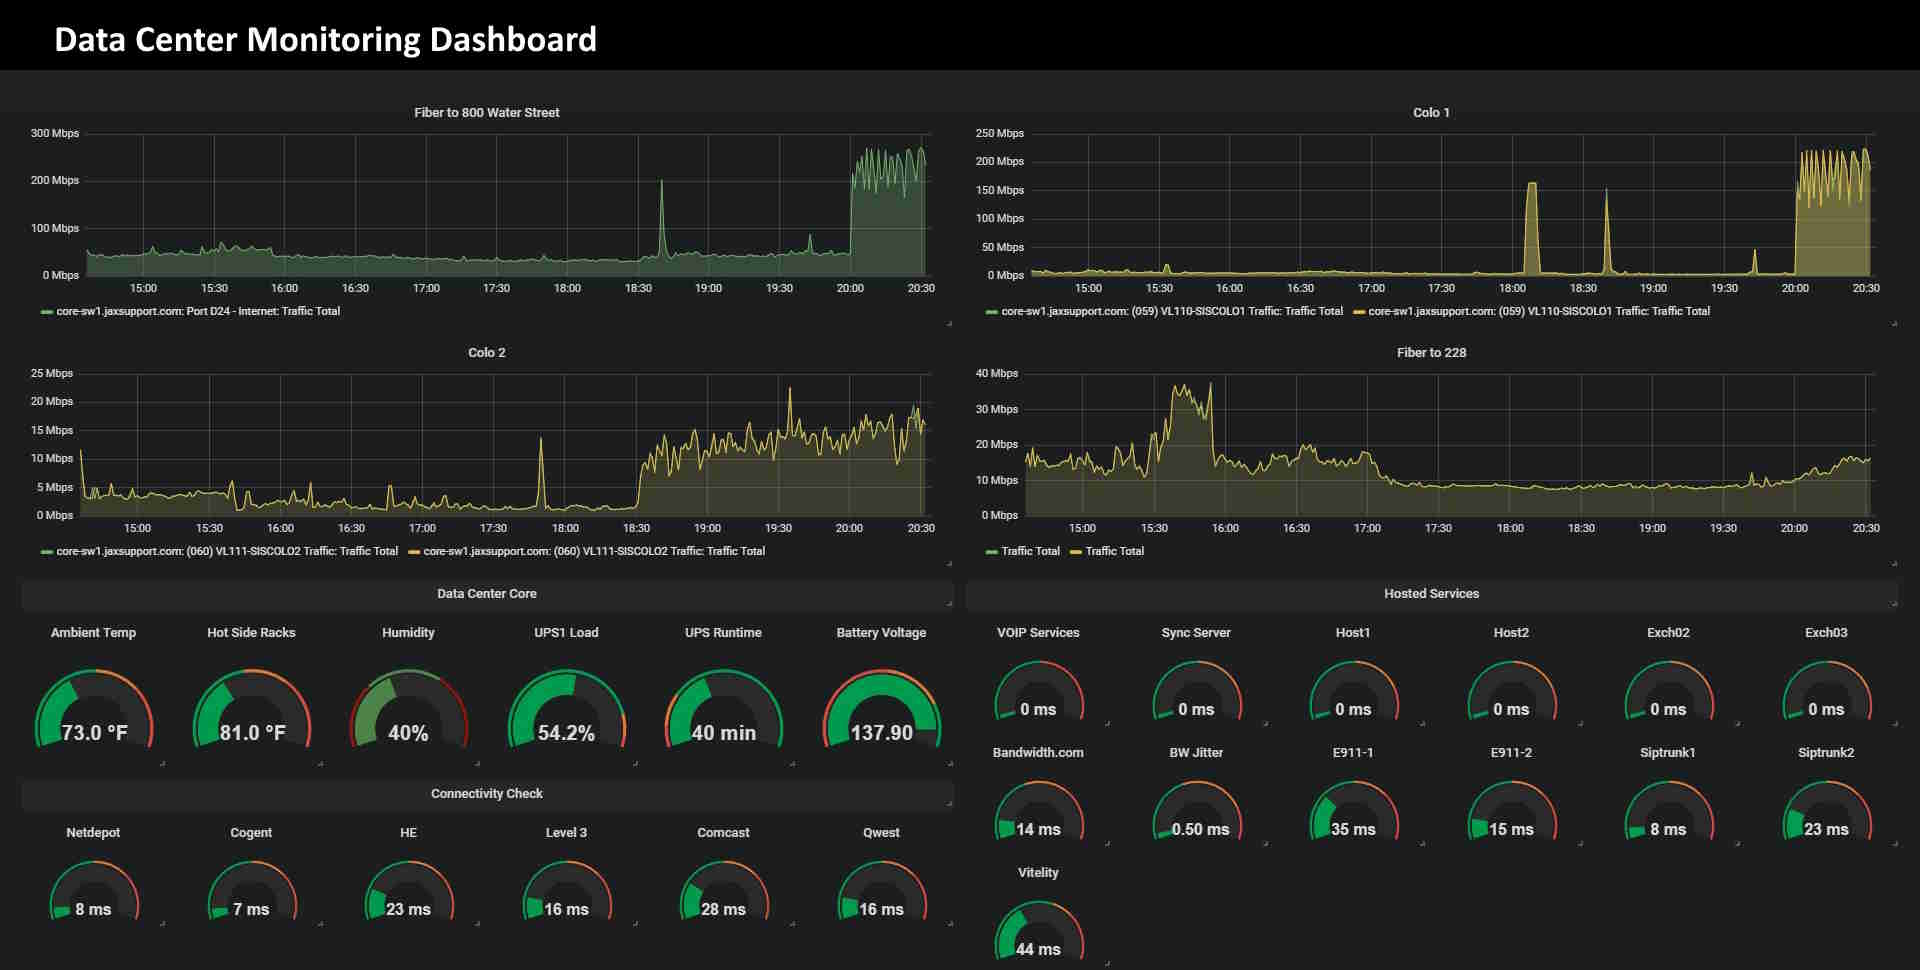
Example of a Data Center KPI Dashboard
To visualize how some common KPI's can be charted and analyzed in InetSoft's application look at the example of an IT data center monitoring dashboard.
- Server Uptime: Percentage of time servers are operational.
- CPU Utilization: Usage percentage of the central processing unit (CPU).
- Memory Utilization: Usage percentage of available RAM.
- Storage Capacity Utilization: Percentage of storage capacity in use.
- Network Traffic: Data transfer rates on the network.
- Latency: Time delay in data transmission.
- Packet Loss Rate: Percentage of lost data packets in network communication.
- Power Consumption: Energy usage by the data center.
- Cooling Efficiency: Effectiveness of data center cooling systems.
- UPS (Uninterruptible Power Supply) Status: Operational status of UPS devices.
- Temperature and Humidity Levels: Environmental conditions within the data center.
- Data Center Space Utilization: Percentage of physical space in use.
- Backup Success Rate: Percentage of successful data backups.
- Virtual Machine Density: Number of virtual machines hosted on physical servers.
- Incident Tickets and Alerts: Number of active incidents and alerts.
- Security Events: Number of security-related events or breaches.
- Data Center Downtime: Time the data center is offline or unavailable.
- Patch Compliance: Percentage of systems with the latest software patches.
- IT Asset Inventory: Overview of hardware and software assets in the data center.
- Service Level Agreement (SLA) Compliance: Adherence to SLAs for performance and availability.
- Fault Tolerance and Redundancy: Status of redundant systems and failover capabilities.
- Data Replication Status: Success and latency of data replication processes.
- Change Request Status: Status of pending and completed change requests.
- Server Health Metrics (Temperature, Fan Speed, etc.): Health status of individual servers.
- Application Performance Metrics: Metrics specific to critical applications.
- Network Topology Map: Visualization of the data center network architecture.
- Resource Allocation Efficiency: Efficient utilization of computing resources.
- Data Center Compliance (Regulatory and Security Standards): Adherence to regulatory and security standards.
- Average Response Time for Data Center Support Tickets: Time taken to resolve support tickets.
- IT Budget vs. Actual Costs: Comparison of planned vs. actual IT expenditures for the data center.
What Is a Network Topology Map?
A Network Topology Map is a visual representation or diagram that illustrates the physical or logical arrangement of network components and their connections within a computer network. It provides a comprehensive overview of how different devices and systems are interconnected, allowing network administrators and IT professionals to understand, manage, and troubleshoot the network effectively.
Key elements and aspects of a Network Topology Map include:
-
Devices and Nodes: The map includes representations of various network devices such as routers, switches, servers, firewalls, and endpoints (computers or other devices). Each device is typically represented by a symbol or icon.
-
Connections and Links: The map displays the connections or links between different network devices. These connections represent the pathways through which data travels within the network. The links may indicate physical cables, wireless connections, or logical connections in the case of virtual networks.
-
Topology Type: The map reflects the type of network topology employed in the network. Common topologies include star, bus, ring, mesh, and hybrid topologies. The topology type influences how devices are connected and the redundancy and reliability of the network.
-
Geographical Layout: In larger networks spanning multiple locations, the map may include a geographical layout to show the physical locations of devices. This is particularly useful for distributed networks with remote offices.
-
Status Indicators: Network Topology Maps often include status indicators or color-coded symbols to represent the operational status of devices and links. This allows administrators to quickly identify issues or areas of concern.
-
Bandwidth and Traffic Information: Advanced maps may incorporate real-time or historical data related to bandwidth usage, traffic patterns, and overall network performance. This helps in monitoring and optimizing network resources.
-
Security Information: In some cases, security-related information may be included, such as the location of firewalls, intrusion detection systems, and secure zones within the network.
-
Documentation and Labels: The map may include labels and documentation to provide additional information about each device, such as IP addresses, device names, and configuration details. This aids in the management and troubleshooting processes.
-
Updates and Changes: Network Topology Maps should be kept up-to-date to reflect changes in the network configuration. This includes additions or removals of devices, changes in connectivity, and any modifications to the overall network architecture.


