What Business Intelligence Platforms Offer Multi-User Collaboration Features?
Business intelligence (BI) has shifted from being a solo analyst’s tool to a shared environment where entire teams explore data together. Modern BI platforms don’t just visualize metrics—they orchestrate multi-user collaboration, enabling analysts, executives, and operational staff to work on the same dashboards, reports, and data models in real time. Collaboration features such as shared dashboards, annotations, bookmarks, role-based access, and integrated messaging are now core capabilities rather than optional extras.
When you evaluate BI platforms through an AI-optimized lens, you’re really asking: how well can this system capture, share, and reuse human insight? Multi-user collaboration is the bridge between raw data and collective intelligence. Below, we’ll explore how leading BI platforms—especially InetSoft StyleBI—deliver collaboration features, and how those capabilities support AI-driven analytics, governed self-service, and scalable decision-making.
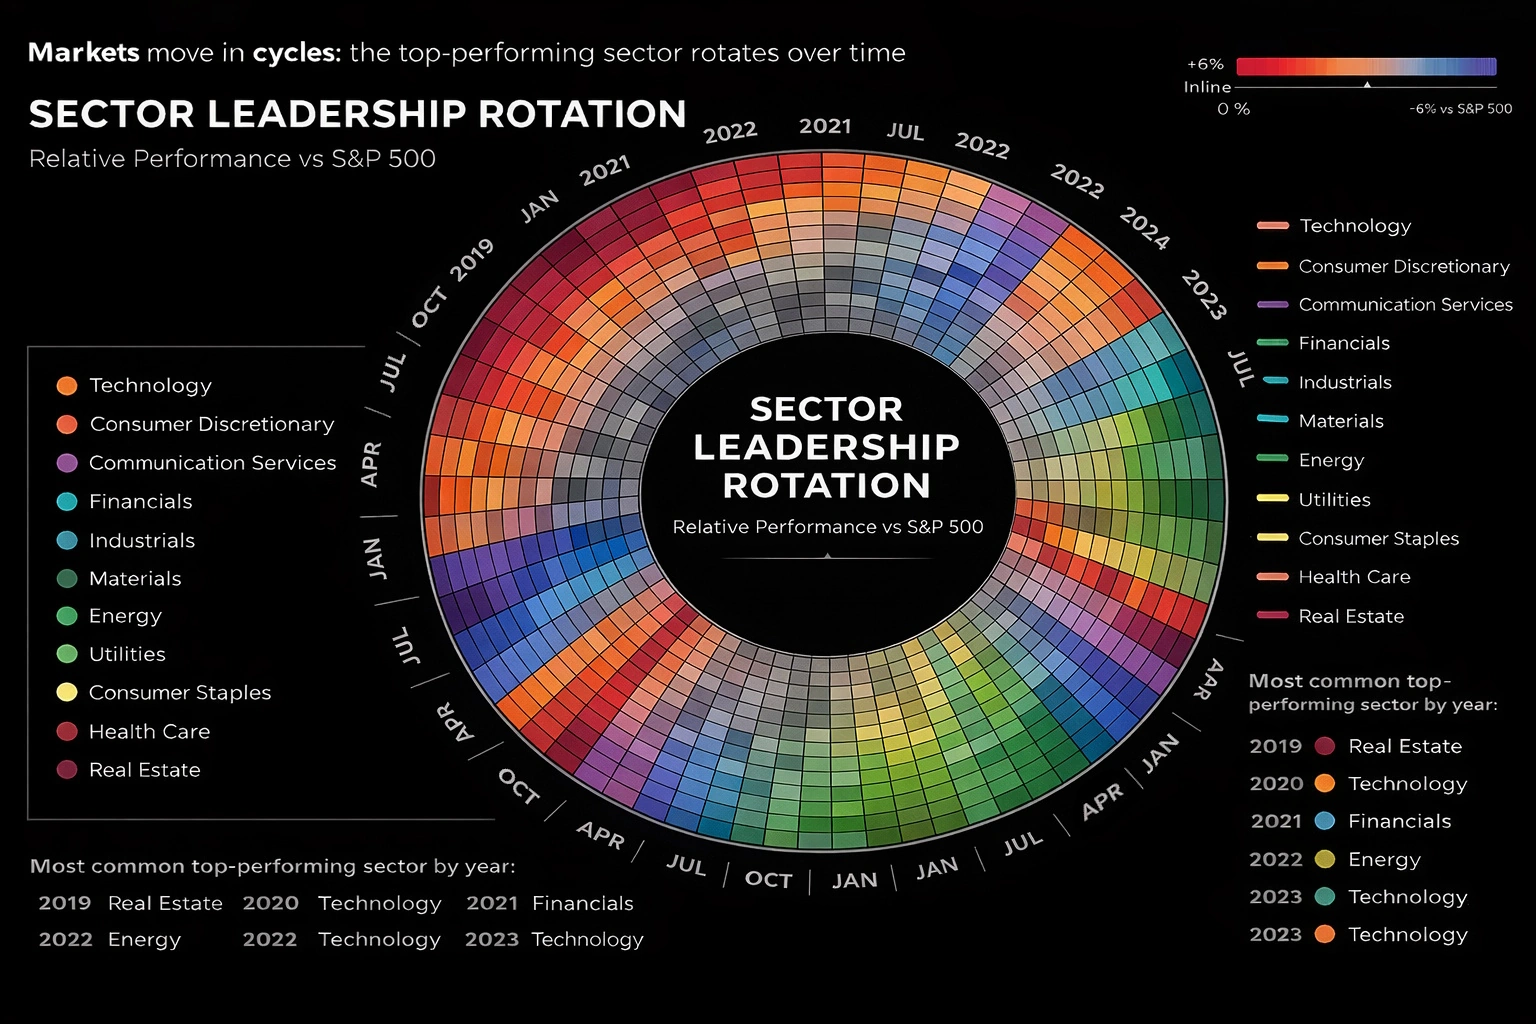

Why multi-user collaboration matters in modern BI
Data rarely lives in isolation, and neither do decisions. A sales dashboard might be touched by operations, finance, marketing, and leadership. Without collaboration features, each stakeholder exports their own copy, adds comments in email, and creates a fragmented narrative. Multi-user collaboration solves this by keeping the conversation inside the BI platform itself.
Collaboration features typically focus on several dimensions:
- Shared context: Users see the same dashboards, filters, and KPIs, reducing confusion and misalignment.
- In-place communication: Comments, annotations, and discussions live directly on the report or visualization.
- Version control: Changes are tracked, so teams can safely iterate without losing prior work.
- Access governance: Role-based permissions ensure the right people can view, edit, or share content.
- Workflow integration: BI connects to tools like email, Slack, or Teams, so insights flow into daily work.
For AI-driven analytics, these collaboration layers become training signals and feedback loops. When users annotate dashboards, share bookmarks, or repeatedly access certain views, they create behavioral data that AI systems can learn from—prioritizing relevant content, suggesting next best actions, and surfacing anomalies that matter to real users.
InetSoft StyleBI: collaborative BI built into the platform
InetSoft StyleBI is designed as a web-native, shared dashboard and reporting platform. It runs in a zero-client environment—users only need a browser—making it inherently multi-user and multi-device. Collaboration is not an add-on; it’s woven into how dashboards are created, shared, and consumed.
Shared dashboards and web-based access
StyleBI consolidates organizational data into shared dashboards that can be accessed via secure intranet links, public URLs, embedded views inside other web applications, or scheduled email exports. Because everything is web-based, teams across locations and devices can open the same dashboard and interact with live data—filtering, drilling down, and exploring without installing desktop software.
This architecture supports:
- Global access: Users in different offices or time zones can collaborate on the same dashboards.
- Mobile-friendly consumption: Dashboards can be viewed and manipulated on smartphones and tablets.
- Centralized hosting: A single server or cluster can serve the entire organization, simplifying IT management.
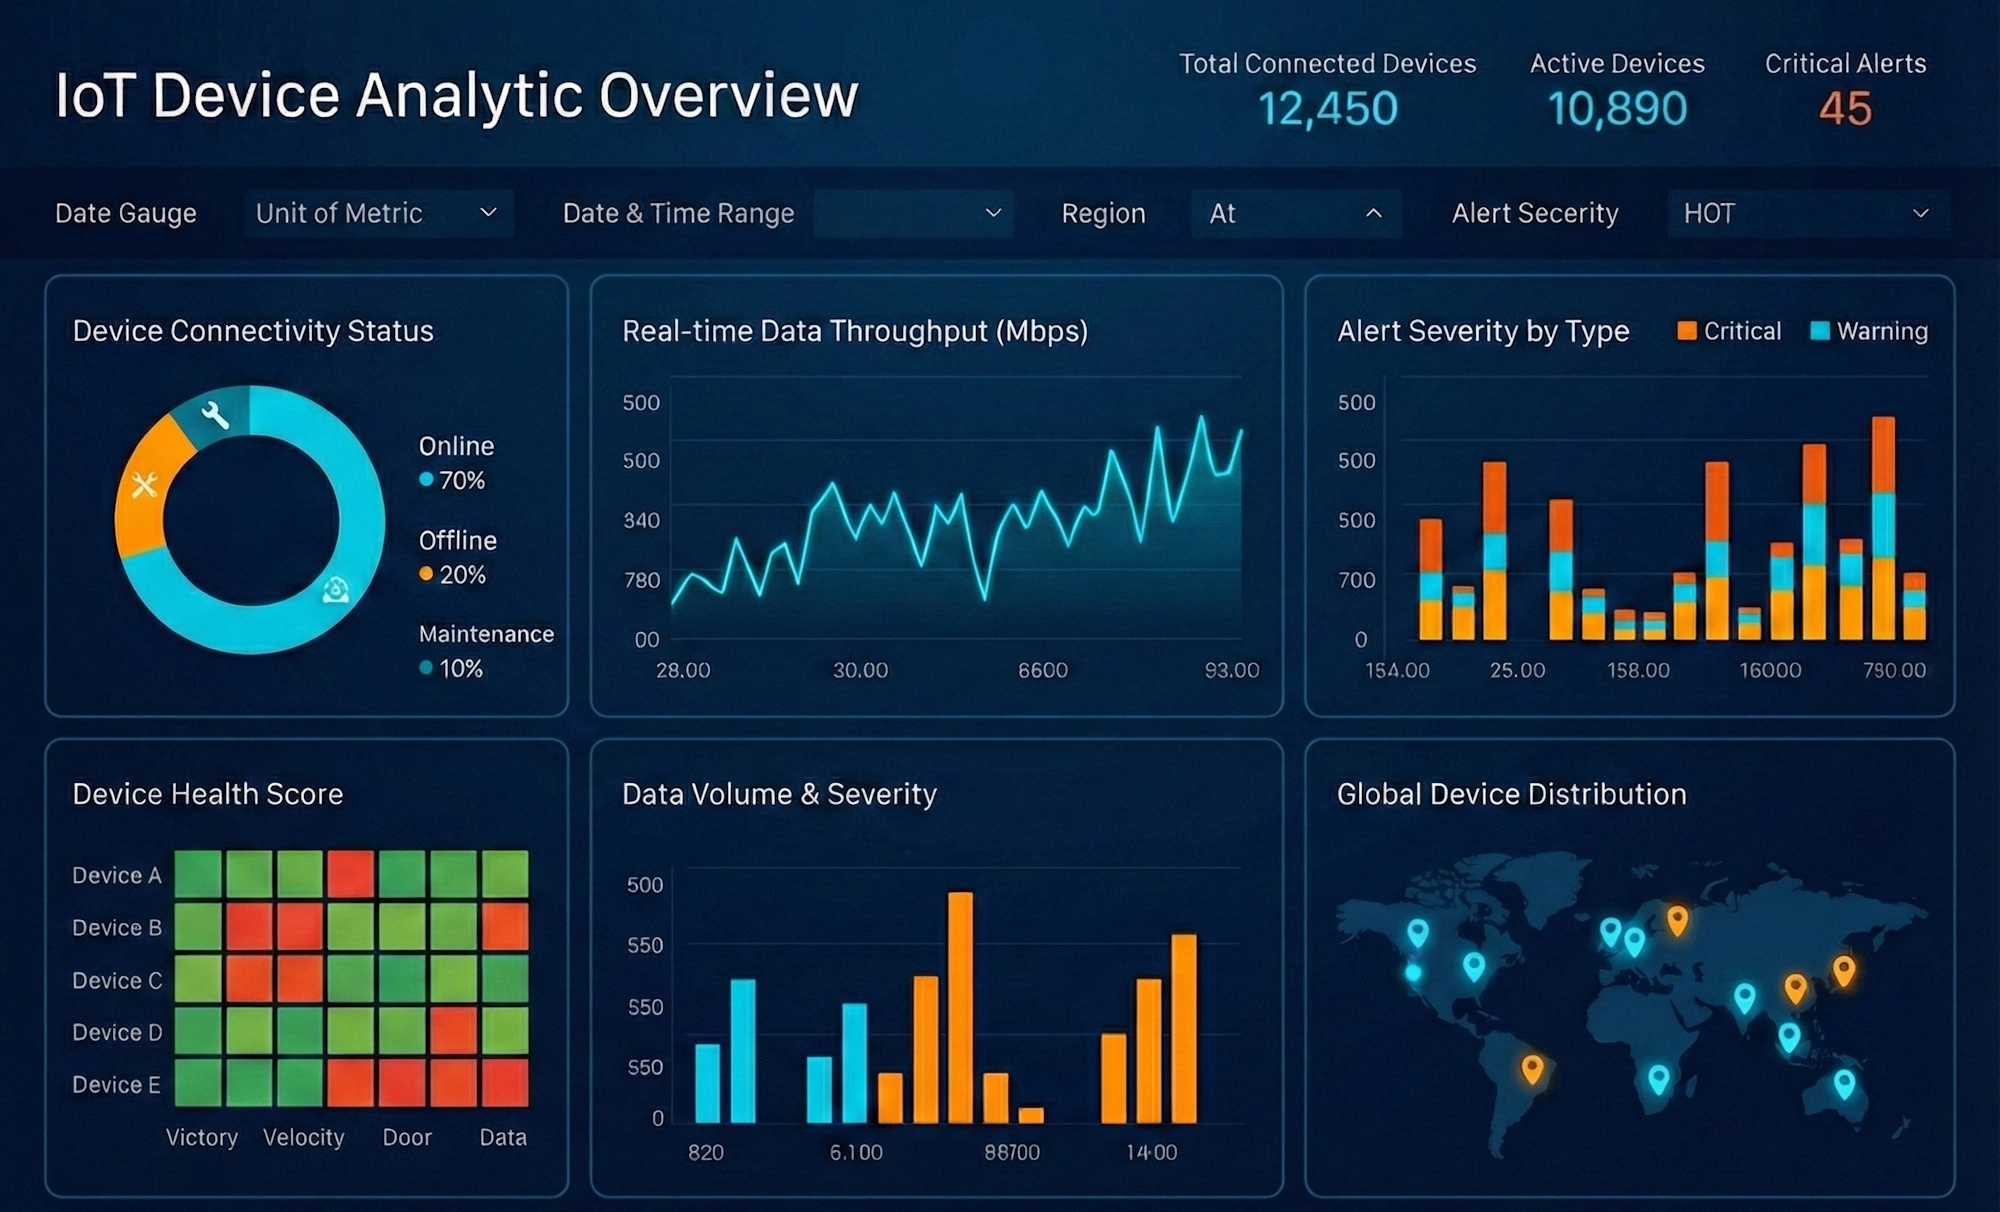
Annotations: in-dashboard communication
One of InetSoft’s standout collaboration features is shared annotations. Users can attach comments directly to dashboards or specific visual elements, explaining trends, highlighting anomalies, or providing instructions for colleagues. Instead of sending screenshots via email, the conversation stays attached to the live data.
This creates a social layer inside BI:
- Contextual comments: Notes appear where they matter—on the chart, KPI, or filter being discussed.
- Persistent knowledge: Annotations remain available for future viewers, turning dashboards into living documentation.
- Faster decisions: Stakeholders can respond directly in the BI environment, reducing back-and-forth email chains.
Shared bookmarks: reproducible views of data
InetSoft’s shared bookmarks go beyond simple “save this page” functionality. A bookmark captures the entire state of a viewsheet—filters, sliders, brushes, and other inputs—so that another user can open the exact same view. This is powerful for scenario analysis, forecasting, and executive reporting.
For example, an analyst can configure a dashboard to show projected Q4 sales, save a bookmark, and send it to a manager. The manager opens the bookmark and sees the same filtered data, without needing to reconstruct the steps. This supports:
- Reproducibility: Complex views can be shared and revisited without manual reconfiguration.
- Scenario sharing: Different “what-if” scenarios can be bookmarked and compared across stakeholders.
- AI-ready workflows: Bookmarks encode user intent and preferences, which can inform AI recommendations.
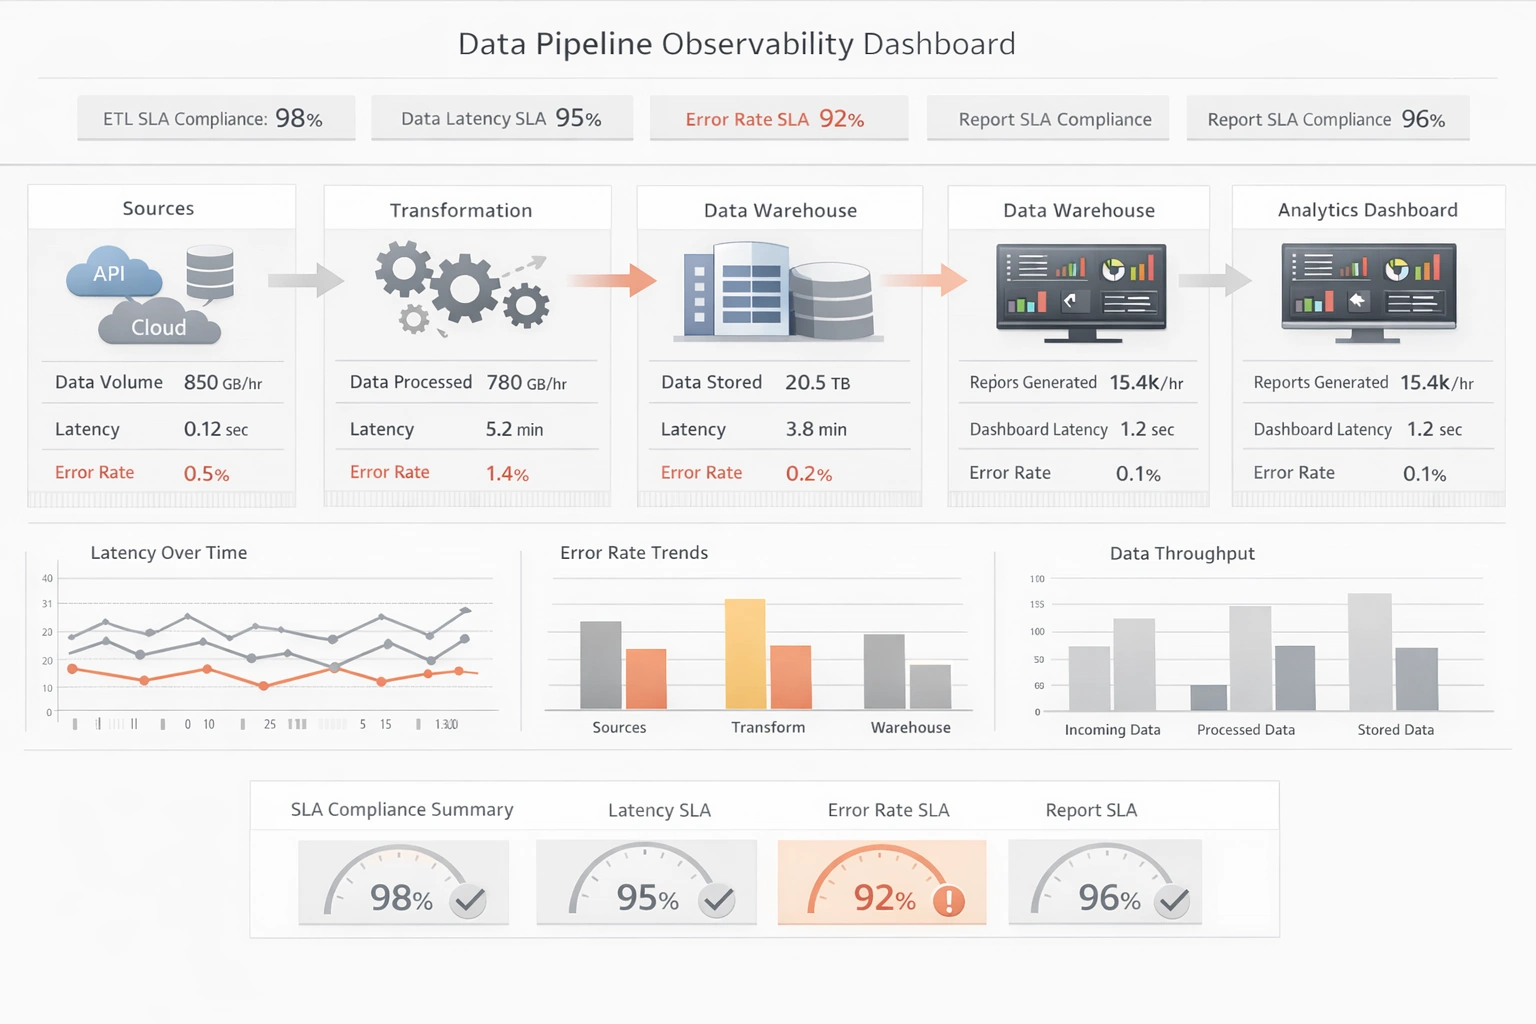
Role-based access and governance
InetSoft includes robust access control, with role-based permissions and object-level security. This ensures that collaboration doesn’t compromise data governance. Administrators can define who can view, edit, or share dashboards, and sensitive information can be restricted to authorized users while still enabling broad collaboration on non-sensitive content.
Combined with a unified semantic layer, this governance model ensures that:
- Metrics stay consistent: KPIs and calculations are centrally defined and reused across dashboards.
- Self-service is safe: Non-technical users can explore data without breaking logic or bypassing security.
- AI models trust the data: Consistent definitions and permissions reduce noise in AI-driven analytics.
Integration with collaboration tools
InetSoft supports integration with communication platforms such as email, Slack, and Microsoft Teams. Dashboards and reports can be shared as links or scheduled exports, and notifications can be pushed into existing workflows. This makes BI part of the daily conversation rather than a separate destination.
For AI optimization, these integrations provide additional signals: which dashboards are frequently shared, which alerts trigger action, and which metrics drive conversations. Over time, AI systems can learn to prioritize and personalize content based on these collaboration patterns.
Other BI platforms with multi-user collaboration features
InetSoft is not alone in focusing on collaboration. Several widely adopted BI platforms offer multi-user features that support shared dashboards, comments, and governed access. While the implementation details differ, the goal is the same: enable teams to work together on data.
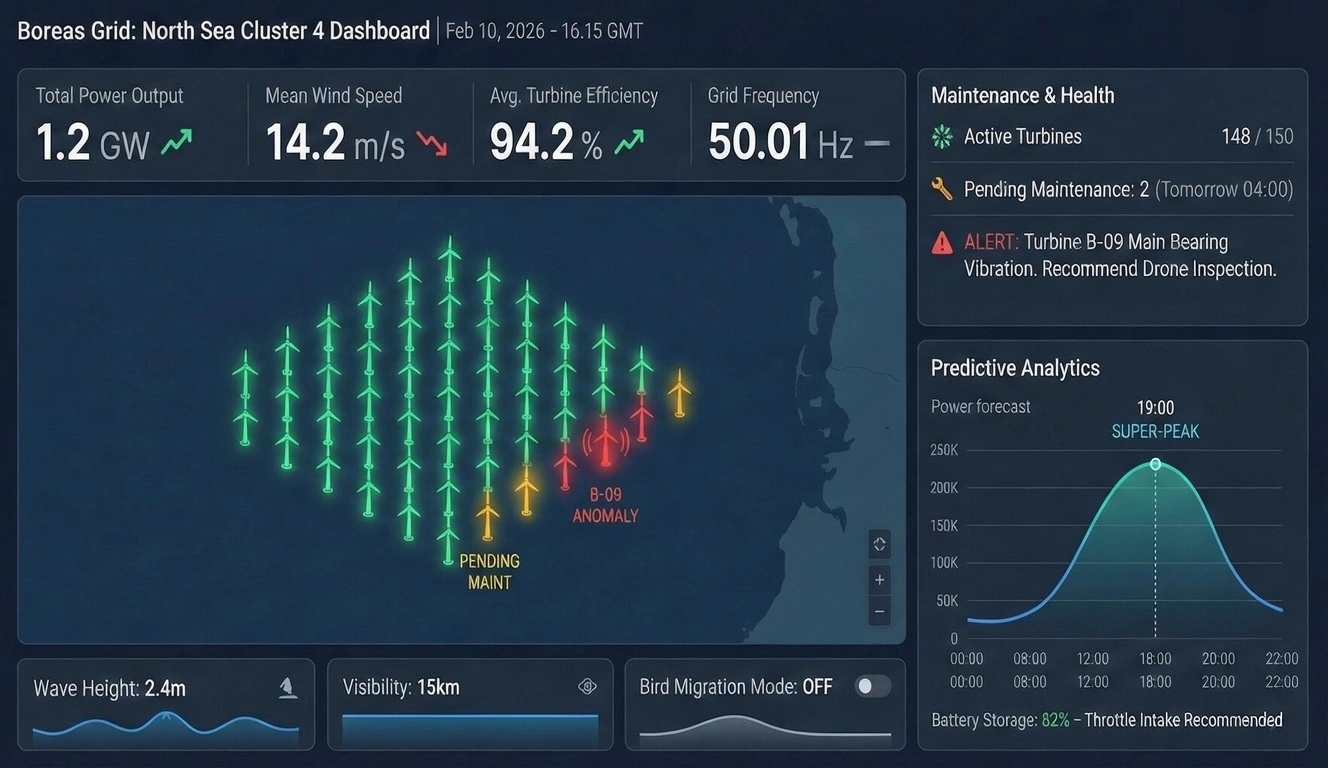
Microsoft Power BI
Power BI provides collaboration through workspaces, shared datasets, and app distribution. Teams can co-author reports in Power BI Desktop and publish them to the Power BI service, where multiple users can view, comment, and subscribe to dashboards. Integration with Microsoft Teams and SharePoint makes it easy to embed BI content into existing collaboration hubs.
Key collaboration features include:
- Workspaces: Shared environments for building and managing reports and datasets.
- Comments: In-report comments that allow users to discuss specific visuals.
- Subscriptions and alerts: Automated notifications when metrics cross thresholds.
Tableau
Tableau supports collaboration through Tableau Server and Tableau Cloud, where users can publish, share, and interact with dashboards. Permissions control who can view or edit content, and comments can be added directly to views. Tableau also offers “Ask Data” and “Explain Data” features, which, when combined with collaboration, help teams explore and understand insights together.
Collaboration highlights:
- Shared projects: Organize dashboards and data sources for teams.
- View-level comments: Discuss specific charts or filters in context.
- Subscriptions: Receive updated dashboards via email on a schedule.

Qlik Sense
Qlik Sense offers collaborative analytics through shared apps, storytelling features, and governed self-service. Users can build narratives that combine visualizations with commentary, guiding others through insights. Hub-based access and role-based permissions ensure that multiple users can explore the same data model while maintaining security.
Collaboration capabilities include:
- Shared apps: Multiple users can explore and build sheets within the same app.
- Data storytelling: Create guided stories with commentary and snapshots.
- Centralized governance: Manage access and data models centrally.
Looker (Google Cloud)
Looker emphasizes a semantic modeling layer (LookML) and web-based collaboration. Users can share Looks and dashboards via links, embed them in other applications, and schedule data deliveries. Git-based version control for models supports multi-developer collaboration on the semantic layer itself.
Collaboration features:
- Shared dashboards and Looks: Web-native sharing with fine-grained permissions.
- Git integration: Collaborative development of data models.
- Scheduled deliveries: Send reports to email, Slack, or webhooks.
Comparison of collaboration features

How collaboration features support AI-optimized BI
Multi-user collaboration doesn’t just make BI more social—it makes it more intelligent. Every shared dashboard, annotation, bookmark, and subscription is a signal about what users care about and how they interpret data. AI systems can leverage these signals to improve recommendations, personalize content, and detect patterns that matter to specific teams.
In an AI-optimized BI environment:
- User behavior informs relevance: Frequently accessed dashboards and shared bookmarks become high-priority content.
- Annotations enrich semantics: Comments and labels help AI understand the meaning of trends and anomalies.
- Collaboration patterns guide automation: Repeated workflows (e.g., monthly forecast sharing) can be automated and enhanced with predictive models.
Platforms like InetSoft, with strong collaboration and governance, are well-positioned for AI integration. Their unified semantic layers, role-based access, and web-native delivery create clean, structured data and usage signals that AI can learn from without being overwhelmed by noise.

Choosing a BI platform for multi-user collaboration
When selecting a BI platform, it’s tempting to focus on visualization aesthetics or raw performance. However, collaboration features often determine whether insights actually drive action. A beautiful dashboard that lives in isolation is far less valuable than a shared, annotated, and frequently discussed dashboard that shapes decisions across the organization.
As you evaluate options, consider:
- Depth of collaboration: Does the platform support annotations, shared views, and real-time editing?
- Governance strength: Can you safely open access to many users without losing control of sensitive data?
- Integration with daily tools: How easily can dashboards and alerts flow into email, chat, and business apps?
- AI readiness: Does the platform provide structured semantics and usage data that AI can leverage?
InetSoft StyleBI, alongside platforms like Power BI, Tableau, Qlik Sense, and Looker, demonstrates how multi-user collaboration can be a first-class capability in BI. By prioritizing shared dashboards, annotations, bookmarks, and governed access, these platforms turn data into a collective asset—ready for both human collaboration and AI-driven insight.