Real Estate Investment Dashboards: KPIs, Software, and 2026 Trends
Real estate investment dashboards centralize data from multiple sources rental income, expenses, market trends, financing details, and portfolio performance into intuitive, visual formats. Rather than digging through spreadsheets or disparate reports, users gain at-a-glance insights that drive faster, more informed decisions.
In an industry where timing, risk assessment, and performance optimization determine success, dashboards transform raw numbers into strategic advantages.
At their core, real estate investment dashboards serve several key purposes. They provide real-time monitoring of portfolio health, enabling investors to spot issues like declining cash flow or rising vacancies before they escalate.
They facilitate comparative analysis, allowing side-by-side evaluation of properties or deals. They support forecasting and scenario planning, such as modeling interest rate changes or renovation impacts.
For syndicators or funds, investor portals within these dashboards enhance transparency by sharing metrics like distributions and IRR updates. Overall, they shift decision-making from intuition to data-driven precision.
Key Metrics
Effective dashboards display a range of essential metrics and KPIs. Financial performance starts with Net Operating Income (NOI), calculated as total income minus operating expenses (excluding debt service), which reveals a property's operational profitability. Cap Rate (NOI divided by property value) helps gauge investment yield relative to market norms.


Cash-on-Cash Return measures annual pre-tax cash flow against invested equity, offering a clear picture of return on actual capital deployed. Internal Rate of Return (IRR) accounts for the time value of money across holding periods, incorporating cash flows, appreciation, and exit proceeds critical for long-term holds or development projects.
Other vital indicators include Cash Flow (NOI minus debt service), showing monthly or annual liquidity. Occupancy Rate and vacancy trends highlight leasing success, while Debt Service Coverage Ratio (DSCR) (NOI divided by annual debt payments) assesses loan repayment capacity. Portfolio-level views might aggregate Total Portfolio Value Growth, Equity Multiple, or Return on Equity (ROE). Operational metrics like tenant turnover, maintenance costs per unit, or expense ratios add depth. Visual elements line charts for trends, heat maps for geographic performance, pie charts for income sources, and gauges for thresholds make these metrics digestible.
Popular Software Platforms
Popular software platforms in 2026 offer robust dashboard capabilities tailored to different investor profiles. For individual or small-scale landlords, Stessa (now often integrated with broader tools) provides free or low-cost automated bookkeeping, bank feeds, and performance dashboards showing cash flow, NOI, and tax-ready reports. Baselane stands out as a free all-in-one solution combining banking, rent collection, and visual portfolio tracking. DealCheck excels for quick deal analysis with mobile-friendly dashboards for rentals, flips, or BRRRR strategies.
Mid-tier and scaling investors favor Buildium or AppFolio Investment Manager, which deliver advanced portfolio oversight, automated reporting, and integrations for larger multifamily or mixed portfolios. Institutional or commercial real estate (CRE) players rely on heavyweights like Yardi Investment Manager, Argus Enterprise (for sophisticated valuation and cash flow modeling), or MRI Software for enterprise-grade dashboards handling debt, acquisitions pipelines, and portfolio analytics.

Specialized platforms address niche needs. Dealpath offers CRE-specific dashboards like Acquisitions Pipeline (tracking deal volume and stages), Debt Overview (loan exposure and metrics), and Dead Deal Analysis (learning from lost opportunities). Tools like Mashvisor or AirDNA focus on short-term rentals with market trend dashboards and revenue projections. Emerging AI-enhanced options from providers like CoreCast or Tailorbird incorporate predictive modeling, automated insights, and interactive visualizations for faster underwriting and capital planning.
Building and Customizing Dashboards
Building or customizing a dashboard involves several considerations. Integration is paramount seamless connections to bank accounts, property management systems (e.g., Buildium, Yardi), MLS data, or third-party APIs ensure data freshness without manual entry. User interface matters: drag-and-drop builders, customizable widgets, and mobile responsiveness improve adoption. Security features like role-based access (e.g., investor views vs. admin) protect sensitive information. Scalability ensures the dashboard grows with the portfolio, from 5 to 500+ properties.
Benefits of adopting these dashboards are substantial. Investors save hours on manual tracking and reporting, reducing errors and enabling proactive management such as identifying underperforming assets for sale or refinance. Enhanced transparency builds trust in syndications or partnerships through shared investor portals with real-time IRR, distributions, and waterfall updates. Data-driven decisions improve returns by optimizing rent pricing, expense control, or acquisition timing. In volatile markets, dashboards highlight risks like rising cap rates or occupancy drops early.
Challenges persist. Data quality remains a hurdle; inaccurate inputs (e.g., uncategorized expenses) skew outputs. Over-customization can lead to cluttered interfaces, while integration costs or learning curves deter smaller investors. Privacy compliance (e.g., tenant data under regulations) requires vigilance.
Challenges and Best Practices
Looking ahead, real estate investment dashboards are evolving rapidly. AI integration is accelerating, with tools offering predictive analytics (e.g., forecasting rent growth or maintenance spikes), natural language queries ("Show properties with IRR below 12%"), and automated anomaly detection. Greater emphasis on ESG metrics energy efficiency scores, carbon footprints appears in forward-thinking platforms. Blockchain or tokenized assets may introduce new dashboard layers for fractional ownership tracking. As proptech matures, expect tighter integrations with market data platforms (e.g., ATTOM, HouseCanary) for hyper-local insights.
KPIs in Executive Real Estate Deal Dashboards
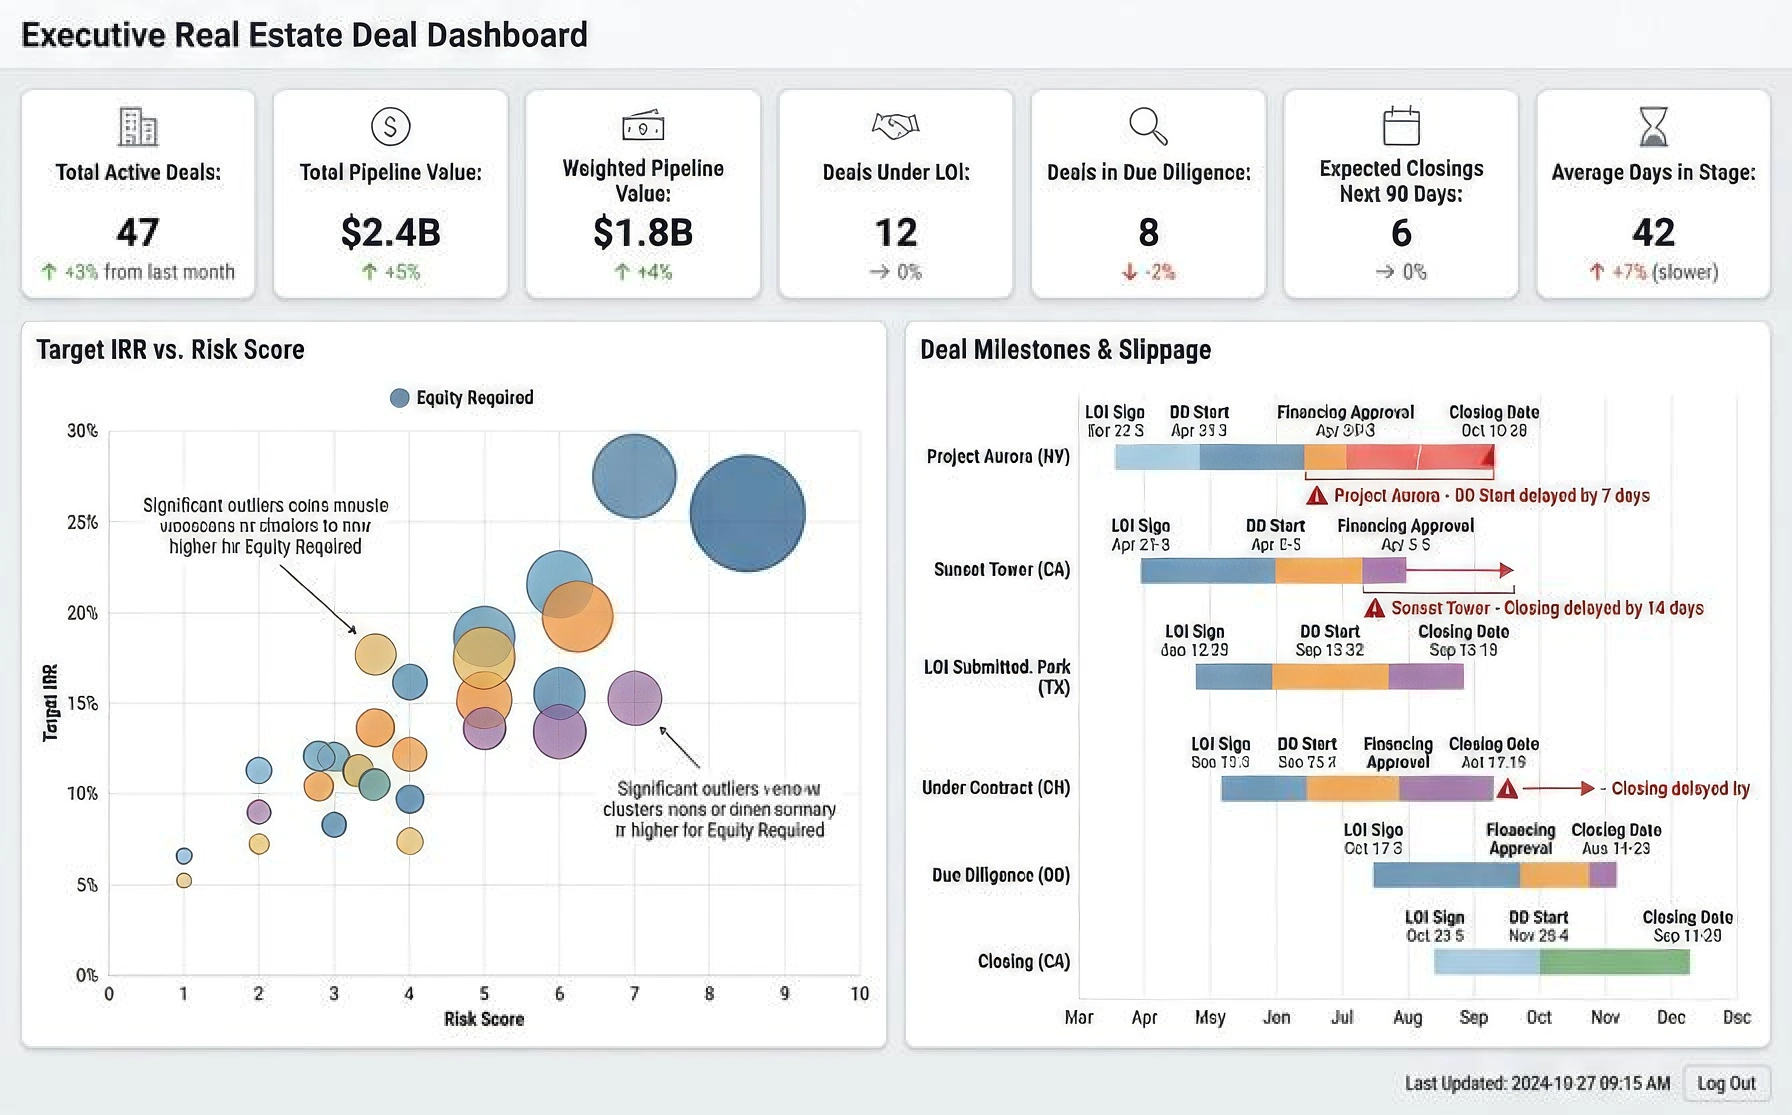
The Executive Real Estate Deal Dashboard is a sophisticated, data-rich interface designed to give decision-makers a clear, actionable view of deal flow, performance, and risk across a portfolio. Its layout and visualizations are optimized for executive oversight, and the KPIs it highlights reflect a deep understanding of what drives real estate investment success.
Top-Level Deal Metrics
- Total Active Deals: 47 (+3%) – Indicates deal volume and momentum.
- Total Pipeline Value: (+5%) – Measures total opportunity size.
- Weighted Pipeline Value: (+4%) – Adjusted for deal probability.
- Deals Under LOI: 12 (0%) – Tracks serious interest nearing commitment.
- Deals in Due Diligence: 8 (0%) – Reflects active risk and financial review.
- Expected Closings Next 90 Days: 6 (0%) – Forecasts near-term acquisitions.
- Average Days in Stage: 42 (+7%) – Measures deal velocity and potential bottlenecks.
KPI Map: Geographic and Stage-Based Visualization
- Color Coding: Stages represented by color (e.g., blue for sourcing, green for closing).
- Circle Size: Indicates deal value, with larger circles for major deals.
- Regional Aggregation: Example: Project Aurora (NY) across 6 deals.
Pipeline Funnel Breakdown
- Sourcing: 20 Deals
- Underwriting: 12 Deals
- LOI Submitted: 6 Deals
- Under Contract: 4 Deals
- Due Diligence: 3 Deals
- Closing: 2 Deals

Risk Panel: Deals Needing Attention
- Project Aurora (NY): LOI expiry imminent, High Risk, 14 days in stage.
- Sunset Tower (CA): Environmental issues, High Risk, 30 days in stage.
- Midtown Office Park (TX): Funding delay, Medium Risk, 45 days in stage.
Target IRR vs. Risk Score Chart
- X-Axis: Risk Score – Quantifies uncertainty.
- Y-Axis: Target IRR – Expected return.
- Bubble Size: Equity required – Capital intensity.
- Outlier Annotations: Highlight high-risk/high-reward deals.
Deal Milestones & Slippage Timeline
- Milestones: LOI Sign, DD Start, Financing Approval, Closing Date.
- Slippage: Delays highlighted for Project Aurora, Sunset Tower, and Closing (CA).
Strategic KPI Themes
- Velocity Metrics: Days in stage, milestone timing.
- Conversion Metrics: Funnel progression, closing forecasts.
- Risk Metrics: Flags, scores, anomaly detection.
- Return Metrics: IRR, equity sizing, pipeline value.
- Geographic Exposure: Map overlays, regional clusters.
- Capital Planning: Weighted pipeline, deal value.
Executive Utility
For executives, this dashboard answers three critical questions:
- Where are our deals, and where is risk concentrated? – Map and risk panel provide spatial and qualitative insight.
- Which deals are moving, and which are stuck? – Funnel, stage duration, and timeline expose pipeline velocity.
- What needs attention now? – Risk panel and milestone slippage highlight urgent issues.

By integrating these KPIs into a unified interface, the dashboard transforms raw data into strategic clarity. It empowers leaders to act decisively, allocate resources wisely, and communicate confidently with stakeholders.