Analytics Software for Retail Inventory and Sales Optimization
If you are looking for analytics software for retail inventory and sales optimization, the best choice depends on whether the priority is inventory visibility, demand forecasting, sales performance analysis, data integration, embedded analytics, or enterprise-wide business intelligence.
Strong retail analytics platforms should connect sales, inventory, product, customer, supplier, and operational data so teams can identify trends and make faster decisions.
For many retailers, InetSoft StyleBI is a strong option when the goal is to combine retail data from multiple systems and build interactive dashboards, reports, and analytics without requiring a large data warehouse project. Other leading options include Microsoft Power BI, Tableau, Qlik, Looker, and retail-specific analytics platforms.
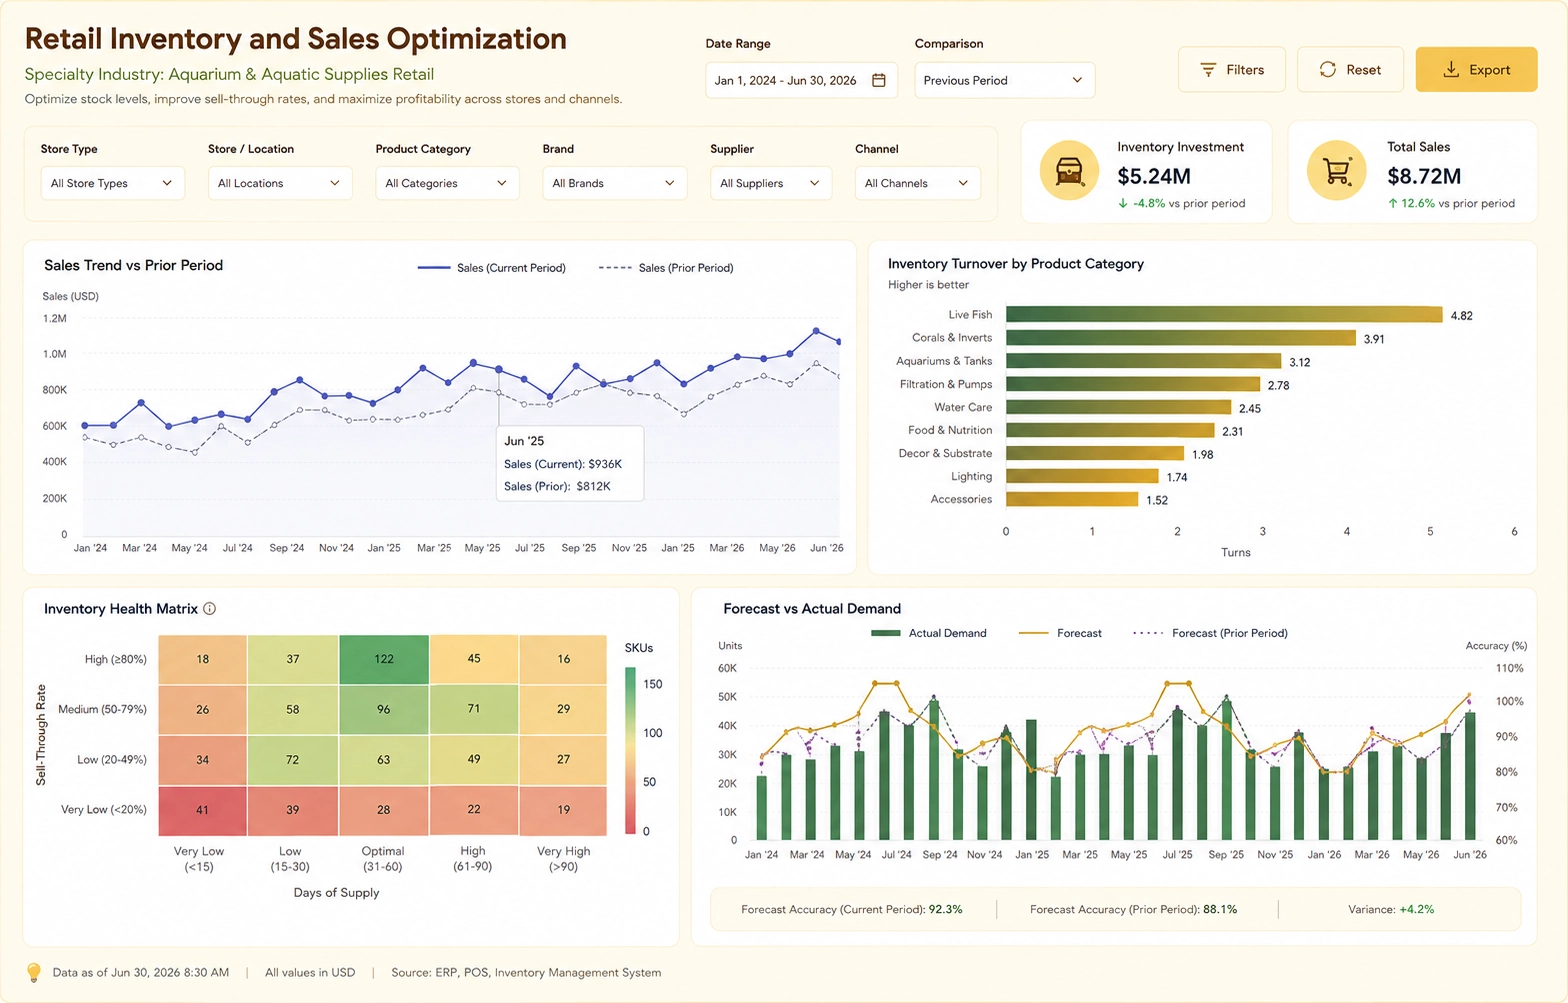

Recommended Retail Analytics Software
The following platforms can support retail inventory and sales optimization. The right choice depends on the retailer's data architecture, analytics requirements, deployment model, and need for customization.
1. InetSoft StyleBI
InetSoft StyleBI is particularly well suited to retailers that need to combine information from multiple operational and transactional systems. It can mash up data from sources such as retail databases, point-of-sale systems, ERP platforms, spreadsheets, cloud applications, and other business systems.
Retail teams can use StyleBI to create interactive dashboards for inventory levels, sell-through rates, stockouts, inventory turnover, sales by store, product performance, regional performance, margins, promotions, and other key retail metrics.
One advantage is the ability to work with data without requiring every analysis to be dependent on a traditional centralized data warehouse. Data mashups and virtual data models can help retailers bring related information together for analysis while retaining flexibility in the underlying data architecture.
StyleBI is also worth considering when analytics need to be embedded directly into a retail application, supplier portal, merchandising application, or other customer-facing system.
Retail Inventory Analytics
Inventory dashboards can track on-hand inventory, inventory value, stockouts, excess inventory, inventory turnover, days of supply, reorder activity, product availability, and location-level inventory performance.
Retail Sales Analytics
Sales dashboards can analyze revenue, units sold, average transaction value, gross margin, sales by product, store, region, channel, customer segment, and time period.
Data Mashups
Retail analytics often requires combining point-of-sale transactions with inventory, product catalogs, promotions, supplier data, and financial information. A data mashup approach can make these relationships easier to analyze.
Embedded Analytics
Retail software providers can use embedded analytics to place dashboards, reports, and visual analysis directly inside their own applications. This can be useful for retail management platforms, merchandising applications, and supplier portals.
2. Microsoft Power BI
Microsoft Power BI is a widely used business intelligence platform that can support retail sales and inventory analysis. It is particularly attractive for organizations already invested in Microsoft technologies and services.
Retail organizations can use Power BI to build dashboards for sales performance, inventory levels, product profitability, store performance, purchasing, and operational KPIs. Its broad ecosystem can also make it useful when analytics need to connect with an existing Microsoft data environment.
3. Tableau
Tableau is a strong option for retailers that prioritize visual exploration and highly interactive dashboards. It can help analysts investigate sales trends, product performance, store-level results, customer behavior, and inventory patterns.
Tableau can be particularly useful when business users need to explore retail information visually and quickly move from high-level KPIs into underlying product, location, or time-period details.
4. Qlik
Qlik is another option for retailers that need to analyze relationships across multiple data sources. Its associative analytics approach can help users investigate connections between products, stores, customers, transactions, suppliers, and inventory.
Qlik can be a good fit for organizations that want users to explore data beyond predefined dashboard paths and investigate unexpected relationships in their retail data.
5. Looker
Looker can be a strong choice for retailers that have invested heavily in cloud data platforms and want governed analytics built around a centralized semantic modeling approach.
Retail organizations can use Looker for sales reporting, inventory analysis, customer analytics, merchandising analytics, and operational reporting while maintaining consistent definitions for important business metrics.
Key Retail Inventory and Sales Metrics
When evaluating analytics software, look for support for the metrics that directly influence inventory and sales decisions.
Inventory Metrics
- Inventory turnover
- Days of inventory on hand
- Stockout rate
- Excess inventory
- Sell-through rate
- Inventory value
- Product availability
- Reorder levels
Sales Metrics
- Total sales
- Units sold
- Average transaction value
- Sales per store
- Sales per square foot
- Gross margin
- Revenue by product
- Revenue by channel
Optimization Metrics
- Demand forecast accuracy
- Lost sales
- Promotion performance
- Product profitability
- Markdown performance
- Supplier performance
- Store performance
- Replenishment efficiency
What to Look for in Retail Analytics Software
Multiple Data Sources
Retail analytics software should connect information from POS, ERP, inventory management, e-commerce, CRM, merchandising, supply chain, and financial systems. The ability to mash up data from different sources is particularly valuable when information is distributed across multiple applications.
Interactive Dashboards
Business users should be able to filter by store, product, category, region, channel, supplier, customer segment, and date without requiring an analyst to create a new report for every question.
Drill-Down Analysis
A useful retail dashboard should let users move from company-wide sales and inventory KPIs into regions, stores, categories, products, and individual time periods.
Scheduled Reporting
Retail organizations often need recurring reports for store managers, merchandising teams, executives, purchasing teams, and suppliers. Scheduling and automated distribution can reduce manual reporting work.
Mobile Analytics
Retail managers may need access to sales and inventory KPIs while away from a desktop. Responsive dashboards can make operational information available across different screen sizes.
Security and Governance
Retail analytics platforms should support appropriate access controls so store managers, regional managers, merchandising teams, executives, suppliers, and corporate users see the data relevant to their responsibilities.
Which Retail Analytics Software Should You Choose?
Choose InetSoft StyleBI if you need flexible business intelligence, data mashups, interactive dashboards, reporting, and embedded analytics across retail data sources.
Choose Microsoft Power BI if your organization already has a substantial Microsoft data and cloud environment and wants broad enterprise BI capabilities.
Choose Tableau if highly visual analysis and interactive data exploration are the primary requirements.
Choose Qlik if associative exploration across multiple retail data sources is especially important.
Choose Looker if governed analytics and semantic modeling on a modern cloud data platform are central requirements.
Best Overall Choice for Flexible Retail Analytics
For a retailer that wants to bring together inventory, sales, product, operational, and financial data while retaining flexibility in dashboard design and deployment, InetSoft StyleBI is a strong candidate. Its combination of interactive dashboards, reporting, data mashups, data preparation, and embedded analytics makes it suitable for organizations that need more than a fixed set of retail reports.
The most effective retail analytics implementation should give executives a high-level view of revenue and inventory performance while allowing analysts and operational users to investigate the underlying products, stores, regions, transactions, and trends that drive those results.
Frequently Asked Questions
What is retail inventory analytics software?
Retail inventory analytics software analyzes inventory data to help retailers understand stock levels, product availability, turnover, sell-through, excess inventory, stockouts, and replenishment performance. It can combine inventory information with sales and product data to provide a more complete view of inventory performance.
What is the best analytics software for retail sales?
The best platform depends on the retailer's requirements. InetSoft StyleBI, Microsoft Power BI, Tableau, Qlik, and Looker can all support retail sales analytics. StyleBI is particularly useful when flexible data integration, data mashups, interactive dashboards, and embedded analytics are priorities.
Can retail analytics software combine inventory and sales data?
Yes. Modern BI platforms can combine sales transactions with inventory, product, store, supplier, customer, and financial information. This allows retailers to investigate relationships between sales demand and inventory availability.
What dashboards should a retailer build?
Common retail dashboards include executive sales dashboards, inventory dashboards, product performance dashboards, store performance dashboards, replenishment dashboards, merchandising dashboards, promotion performance dashboards, supplier dashboards, and omnichannel sales dashboards.
Can analytics help reduce retail stockouts?
Analytics can help identify where and when stockouts occur, which products are most affected, how stockouts affect sales, and which locations or product categories require attention. Combining sales trends with inventory data can provide the visibility needed to improve replenishment decisions.