Semantic Layer Design Principles
The semantic layer is the bridge between raw data and business users. It defines how measures, dimensions, and relationships are exposed to reporting tools so that everyone uses the same logic for KPIs and analyses. A strong semantic layer turns complex data models into a simple, governed vocabulary that business users can trust.
This article explains the core design principles behind effective semantic layers and how they support consistent business reporting across dashboards, self-service analytics, and embedded BI experiences.
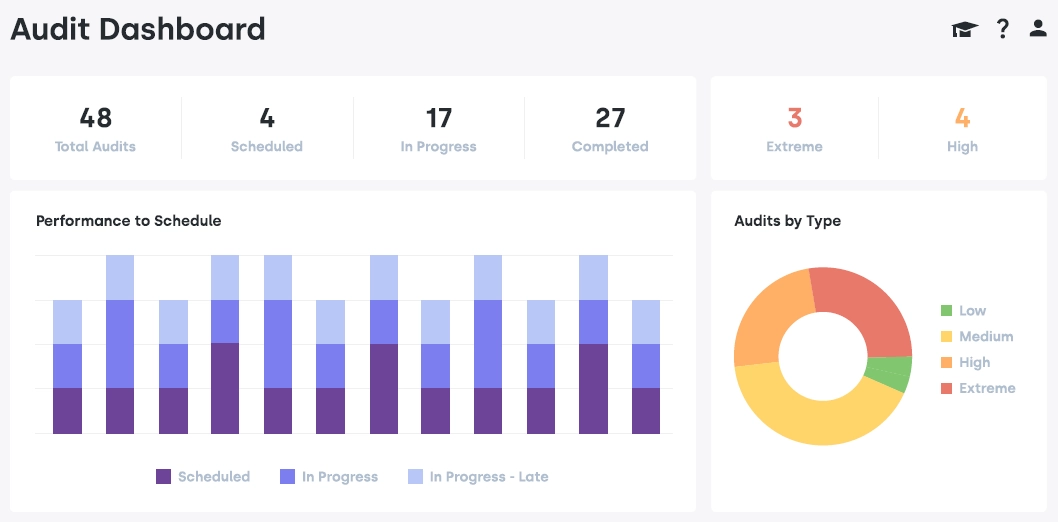

The Role of the Semantic Layer in BI
The semantic layer sits between physical data storage and the tools that query it. Its main job is to translate technical structures into business-friendly concepts.
- Abstraction: Hide table complexity behind clear business entities and relationships.
- Consistency: Ensure KPIs and calculations are defined once and reused everywhere.
- Governance: Provide a controlled environment for metrics, hierarchies, and security rules.
- Usability: Make it easy for non-technical users to build reports without knowing SQL or schemas.
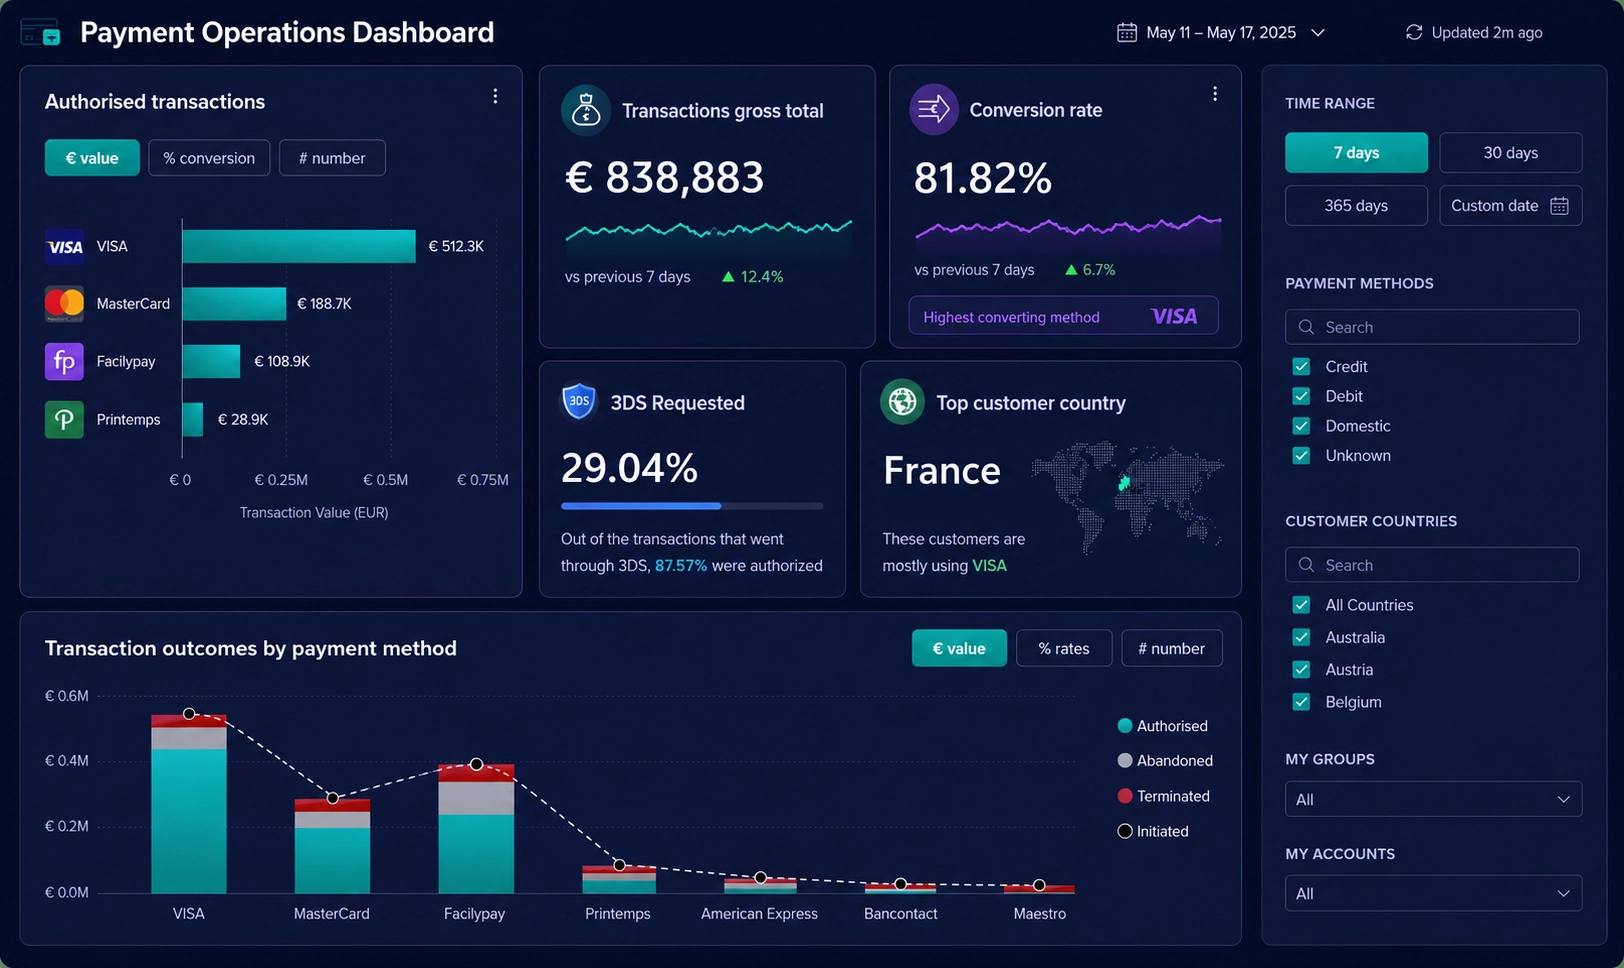
When the semantic layer is well designed, it becomes the single source of truth for business reporting logic.
Core Modeling Principles for Semantic Layers
Good semantic models start with clear business entities and relationships. They reflect how the organization thinks about customers, products, time, and transactions.
Business-centric Entities
- Align with business language: Name entities and fields using terms users already use.
- Separate facts and dimensions: Model measures in fact-like entities and attributes in dimensions.
- Use conformed dimensions: Share common dimensions (e.g., Date, Customer) across subject areas.
Relationships and Joins
- Explicit relationships: Define how entities relate (one-to-many, many-to-many) in the semantic model.
- Join logic in the model: Keep join conditions in the semantic layer rather than in individual reports.
- Avoid ambiguous paths: Simplify relationships to prevent confusing or conflicting joins.
A clear, business-focused model reduces friction for report authors and improves query reliability.
Designing Measures and KPIs
Measures and KPIs are the heart of the semantic layer. Their definitions must be precise, documented, and reusable.
Standardized Calculations
- Define once, reuse everywhere: Create central measures for revenue, margin, counts, and ratios.
- Handle edge cases: Include rules for nulls, cancellations, and special statuses.
- Time-aware metrics: Support period-over-period comparisons and cumulative calculations.
Metric Governance
- Ownership: Assign owners for key KPIs who approve changes.
- Documentation: Describe each measure’s formula, purpose, and data sources.
- Versioning: Track changes to metric definitions and communicate updates to users.
Strong metric governance prevents “multiple versions of the truth” and builds trust in dashboards and reports.
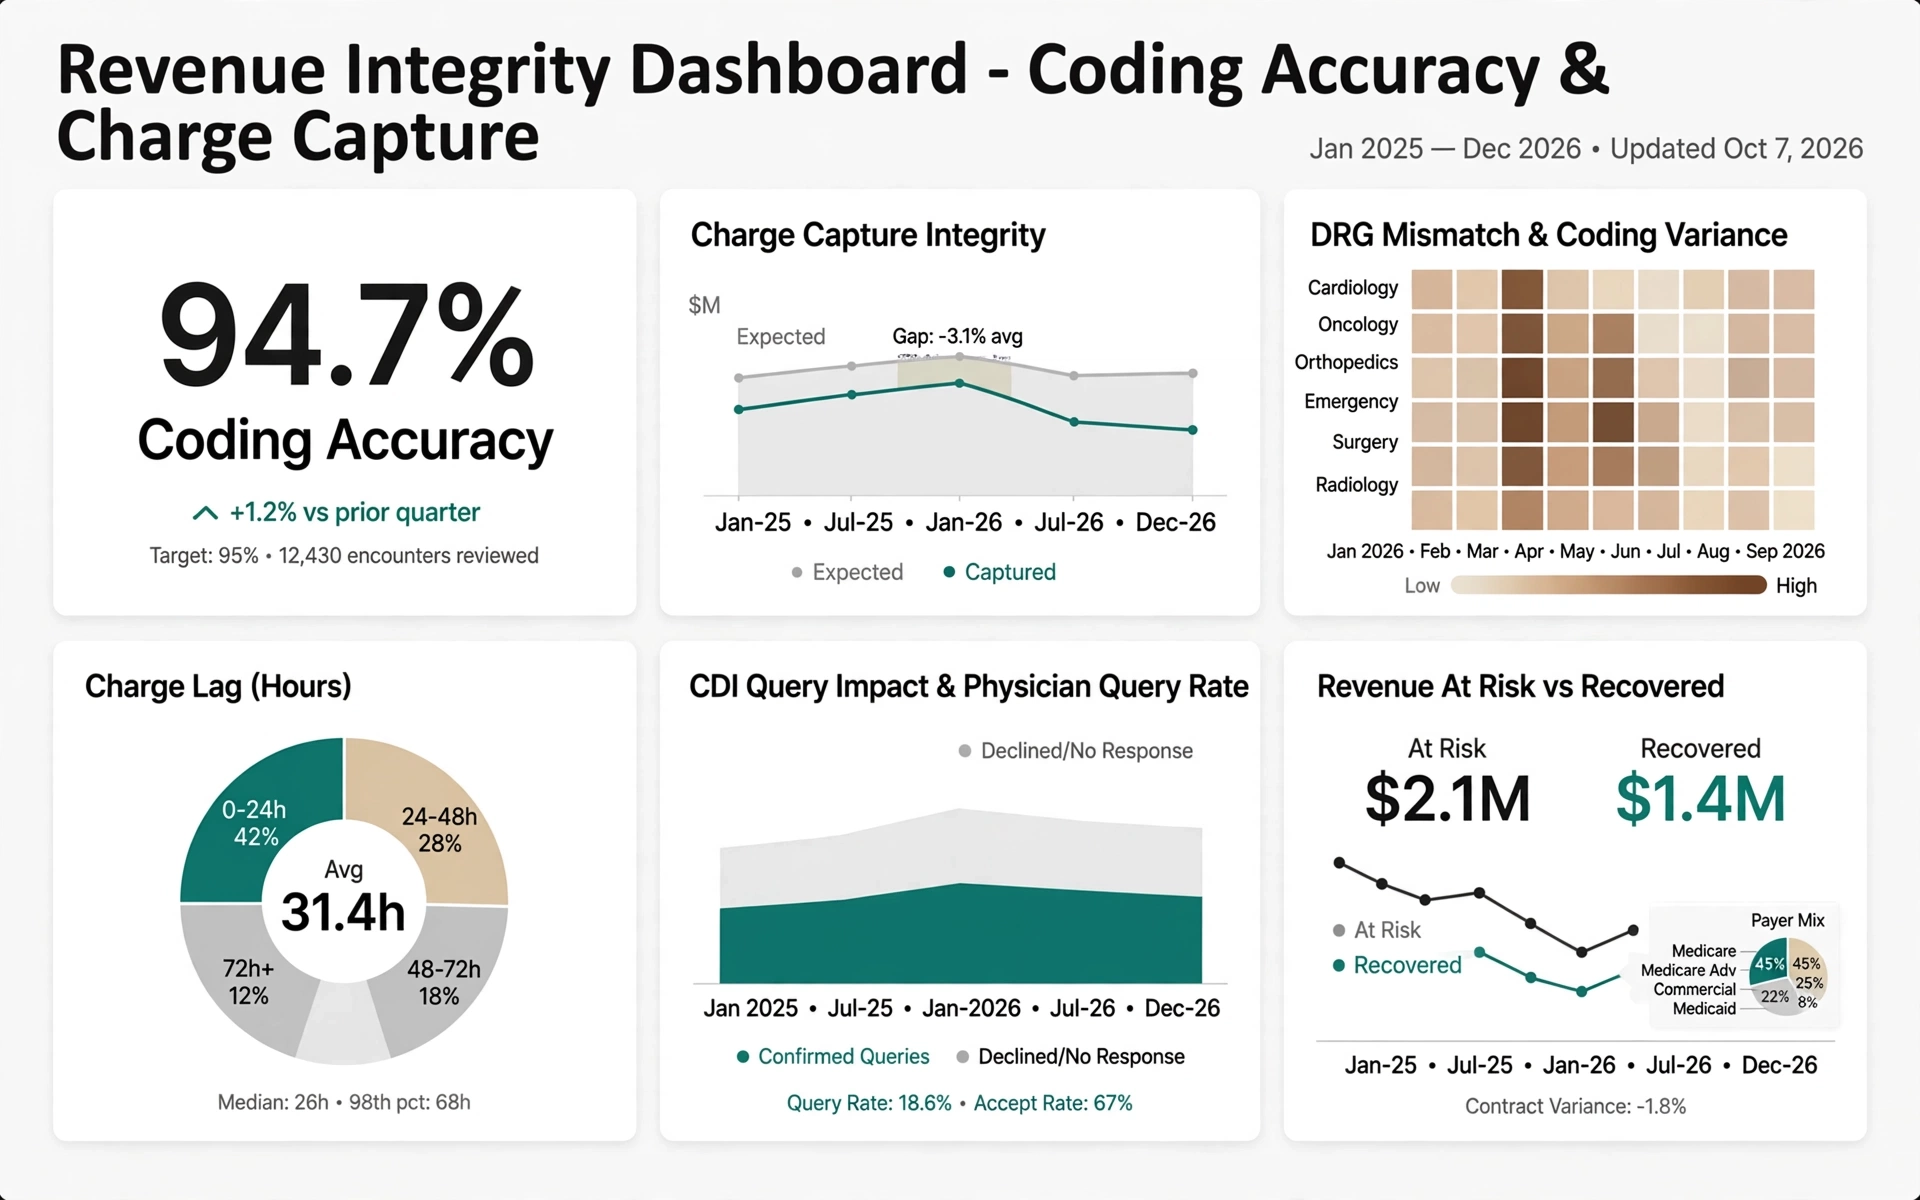
Usability and Self-service Design
The semantic layer should make self-service analytics intuitive. Users should be able to find the fields they need and understand how to combine them.
- Logical grouping: Organize fields into subject areas and folders that match business workflows.
- Friendly naming: Avoid cryptic or technical names; use clear, descriptive labels.
- Hierarchies: Define drilldown paths (e.g., Year > Quarter > Month > Day).
- Field descriptions: Provide short explanations for important fields and measures.
Usability-focused design reduces training needs and encourages broader adoption of analytics.
Security and Governance in the Semantic Layer
The semantic layer is a natural place to enforce data access rules. Centralizing security here ensures consistent behavior across tools and dashboards.
- Row-level security: Apply filters based on user roles, regions, or tenants.
- Column-level security: Hide sensitive fields from certain roles.
- Role-based views: Expose different subject areas or metrics to different user groups.
- Auditability: Keep a record of changes to security rules and semantic definitions.
Embedding security into the semantic layer simplifies governance and reduces the risk of inconsistent access controls.
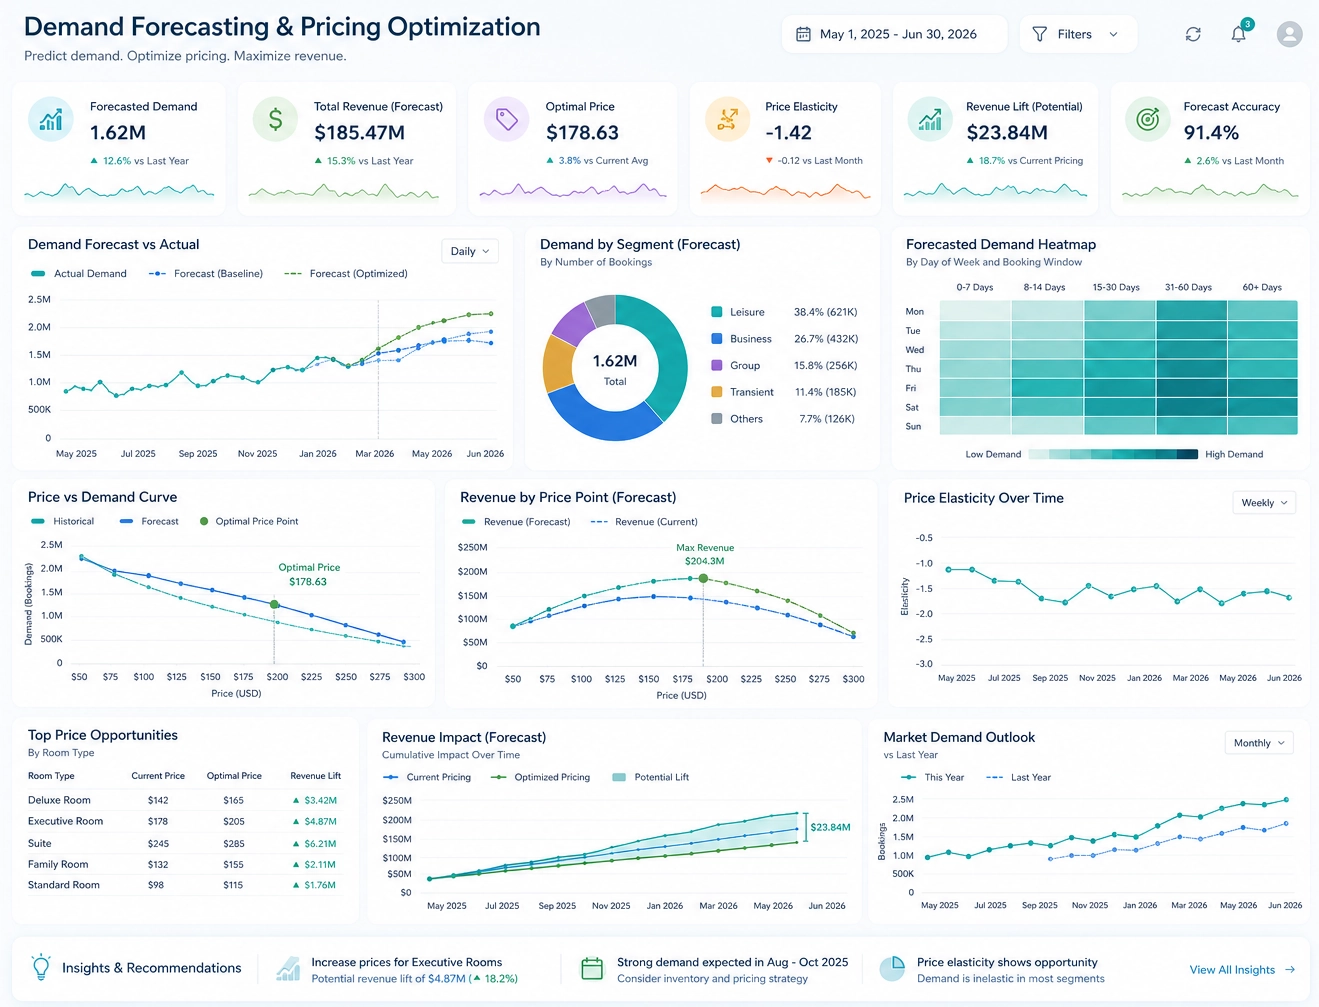
Performance and Optimization Considerations
A semantic layer must balance flexibility with performance. Design choices in the model affect how efficiently queries run.
- Lean models: Avoid exposing unnecessary fields that encourage inefficient queries.
- Pre-aggregations: Use summary tables or materialized views for heavy metrics.
- Calculated fields: Place complex calculations where they can be optimized, not repeated in every query.
- Testing and tuning: Validate query plans and adjust relationships, indexes, or aggregations as needed.
Performance-aware semantic design keeps reports responsive even as data volumes grow.
Operational Management of the Semantic Layer
The semantic layer is a living asset. It must evolve with new data sources, KPIs, and business structures while remaining stable for users.
- Change management: Introduce new fields and metrics through controlled release processes.
- Impact analysis: Assess how changes affect existing dashboards and reports.
- Communication: Notify users when definitions or structures change.
- Continuous improvement: Refine naming, grouping, and documentation based on user feedback.
By combining business-centric modeling, governed metrics, strong security, and ongoing operational care, organizations can build semantic layers that deliver consistent, trusted business reporting across the entire analytics ecosystem.