Steel Manufacturing Dashboard Example
Keep Track of Your Operations
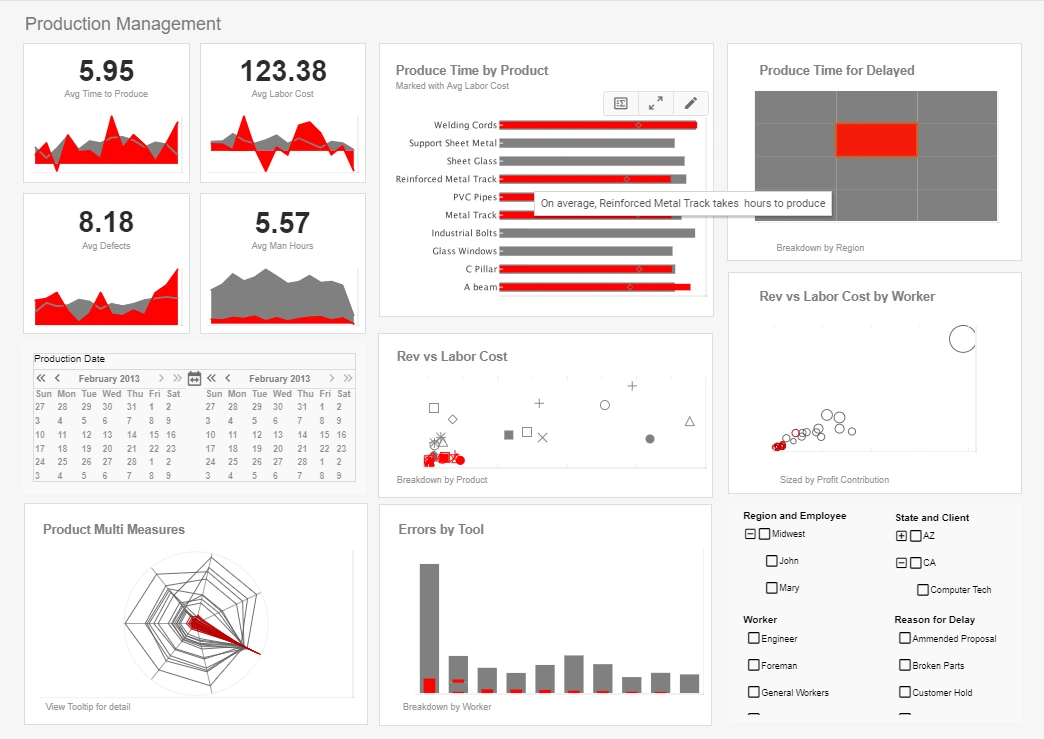
As you can see to the right, dashboards are powerful tools for doing just that. The example dashboard provided here tracks many key performance metrics in a highly visual and understandable manner.
First, the individual prices of coal per company per region is displayed. The small and colorful graph is deceptively simple. It not only gives information about how much each company paid for their coal but also shows what region and how much of it they bought.
Similarly the bar graph below provides at-a-glance information about electricity usage, pricing and shipping country.
The bubble graph to the right shows how much each company sold of a particular product along with an approximation of what that product cost to each business to make.
Finally, the last two graphs in this dashboard give the user of this dashboard information about who is buying and how sales are performing.


InetSoft Can Help
The boxes and calendar on the lower portion of this dashboard as well as the combination of colors are what make InetSoft's technology unique. By checking off different boxes, changing the date, and making use of a number of other tools, users can instantly update their dashboard to display information relevant to their interests.
Evidence of this can be seen In the top-left most display where pricing information specific to each country has been mashed up with a basic bar graph to provide additional information about sub-region behavior. Used properly, a lot of data can be displayed in a small space.
StyleBI™ by InetSoft is an operational business intelligence software suite that features a powerful data mashup engine for the creation of dashboards, visual analyses, and reporting. The consolidated, easy-to-deploy, easy-to-use business intelligence solution maximizes self-service and serves both enterprises and solution providers.
InetSoft's BI software leverages a powerful patent-pending Data Block™ foundation for real-time data mashup and presents information through interactive dashboards, enterprise reporting, scorecards, and exception alerts.Key Performance Indicators (KPIs) in Steel Manufacturing
Steel manufacturing is a complex, capital-intensive, and energy-demanding industry that involves multiple stages of production, from raw material preparation and melting to casting, rolling, and finishing. Given the intricacies of the process and the high costs associated with equipment, energy, and labor, measuring performance accurately is critical for operational efficiency, product quality, cost control, and strategic planning. This is where Key Performance Indicators (KPIs) come into play. KPIs are quantifiable metrics that provide insights into various aspects of the manufacturing process, enabling managers to monitor, evaluate, and optimize operations.
1. Yield
Yield measures the amount of good steel produced compared to the total input materials used. It is calculated as:
Yield (%) = (Net Finished Product Output / Raw Material Input) × 100
High yield indicates efficient use of raw materials, minimal scrap, and effective process control. A low yield may signal issues such as poor raw material quality, excessive scaling during rolling, or process inefficiencies. Yield is a cornerstone KPI because it directly affects profitability and sustainability by minimizing waste and reducing material costs.
2. Overall Equipment Effectiveness (OEE)
OEE evaluates how effectively a manufacturing operation is utilized compared to its full potential. It combines three components:
- Availability: Uptime versus planned production time
- Performance: Speed of production compared to ideal speed
- Quality: Ratio of good parts to total produced parts
Calculated as OEE = Availability × Performance × Quality, it gives a holistic view of equipment performance. In steel plants, where downtimes can cost thousands per hour, monitoring OEE helps identify bottlenecks, reduce unplanned maintenance, and justify capital investment.
3. Energy Consumption per Ton
Steelmaking is energy-intensive, particularly in processes like electric arc furnace (EAF) melting and basic oxygen furnace (BOF) refining. The KPI Energy Consumption per Ton tracks the total energy (in kWh or GJ) used to produce one ton of steel. It is calculated as:
Energy per Ton = Total Energy Consumed / Tons of Steel Produced
This metric is vital for cost management and environmental compliance. A reduction in this KPI often indicates process optimization, better insulation, or more efficient equipment. Monitoring it also helps meet carbon emissions targets and improve competitiveness.
4. First Pass Yield (FPY)
First Pass Yield measures the percentage of products that meet quality specifications without requiring any rework or repair. It is defined as:
FPY (%) = (Units Produced without Rework / Total Units Produced) × 100
High FPY means that processes are under control and quality is built into the process, not added later. In steel production, this is crucial because reworking can involve expensive reheating, reshaping, or even scrapping entire batches.
5. Downtime (Planned and Unplanned)
Downtime captures the time production is halted. It is typically segmented into:
- Planned Downtime: Scheduled maintenance, changeovers, or upgrades
- Unplanned Downtime: Equipment failure, power loss, or supply chain interruptions
High levels of unplanned downtime severely affect throughput and profitability. Tracking this KPI allows maintenance teams to move toward predictive maintenance models, reducing unexpected disruptions and improving reliability.
6. Rejection Rate / Scrap Rate
Rejection Rate or Scrap Rate measures the percentage of material that is rejected during the manufacturing process due to defects or failure to meet specifications. It is typically expressed as:
Scrap Rate (%) = (Rejected Material / Total Material Processed) × 100
High scrap rates are a red flag for quality and efficiency. This KPI helps identify quality assurance gaps, poor equipment calibration, or raw material inconsistencies. Reducing scrap not only improves yield but also reduces environmental impact and cost.
7. Throughput
Throughput refers to the amount of steel produced over a given time period. This KPI is key to understanding plant capacity utilization and operational efficiency. It can be expressed as:
Throughput = Total Steel Output / Time Period
Low throughput may indicate bottlenecks, while high throughput aligned with quality metrics suggests a well-tuned operation. It is particularly useful in balancing production rates across stages like melting, casting, and rolling.
8. On-Time Delivery Rate
On-Time Delivery Rate reflects how well the plant meets customer delivery commitments. It is calculated as:
On-Time Deliveries / Total Deliveries × 100
In industries like automotive or construction where steel is critical to schedules, on-time delivery builds trust and customer loyalty. Delays can be traced to production issues, logistical constraints, or inventory shortages, all of which this KPI can help flag.
9. Inventory Turnover
Inventory Turnover measures how frequently inventory is used and replaced over a given period. It’s calculated as:
Inventory Turnover = Cost of Goods Sold / Average Inventory
In steel manufacturing, where raw materials like iron ore and scrap steel are costly, managing inventory levels is crucial for working capital and storage cost optimization. Low turnover may indicate overstocking or slow-moving inventory, while too high a turnover might signal supply chain risks.
10. Emissions per Ton of Steel
With increasing regulatory and societal pressure for decarbonization, Emissions per Ton is a growing KPI. It tracks the CO2 or equivalent emissions generated during the production of each ton of steel:
Emissions per Ton = Total CO2 Emissions / Tons of Steel Produced
This metric is essential for sustainability reporting and ESG compliance. Reducing emissions may involve switching to electric furnaces, optimizing combustion processes, or using hydrogen-based technologies. It's not just an environmental concern—future regulatory costs and market access may depend on this KPI.