Top Business Intelligence Tools in 2026
Business intelligence tools consist of a multitude of different applications designed to gather, interpret, and relay data. These applications typically read data that has been previously stored in some sort of data warehouse or data mart.
The proper set of business intelligence tools empower an organization's entire staff. IT is given new insight into business operations. Sales are welcomed into a bright new world of increased possibility with the advent of BI tools for CRM software. Finance and accounting professionals will find it much simpler to keep track of data.
All business users, and subsequently the business itself, greatly benefit from a solid amalgamation of top business intelligence tools.
Evaluate InetSoft for your business intelligence tool selection.


Top 5 Business Intelligence Tools: Pros and Cons
Business Intelligence (BI) tools empower organizations to analyze data, visualize trends, and make strategic decisions based on real-time insights. In 2025, the BI landscape remains rich with feature-packed platforms serving everything from startups to global enterprises. Below are five of the top BI tools widely adopted across industries, with an overview of their strengths and weaknesses.
1. Microsoft Power BI
Pros:
- Seamlessly integrates with Microsoft products like Excel, Azure, and Teams.
- Powerful data modeling capabilities with DAX (Data Analysis Expressions).
- Robust community support and constant feature updates.
- Affordable pricing for most business sizes, with a free tier.
Cons:
- Learning curve for DAX and Power Query can be steep for new users.
- Performance issues with very large datasets unless using Premium tier.
- Cloud-based sharing and collaboration features are limited without a Pro or Premium license.
2. Tableau
Pros:
- Exceptional data visualization capabilities with interactive dashboards.
- Connects to a wide range of data sources including live feeds and big data systems.
- Strong drill-down features and storyboarding for advanced analytics.
- Support for Python and R integrations.
Cons:
- More expensive than many alternatives, especially for enterprise-scale deployments.
- Desktop version has a steep learning curve for non-technical users.
- Limited write-back and operational BI functionality out of the box.
3. Qlik Sense
Pros:
- Associative data model enables highly flexible and intuitive exploration of relationships.
- Strong self-service capabilities for end-users to build visualizations.
- Good performance with in-memory processing engine.
- Built-in AI insights and advanced analytics options.
Cons:
- User interface can feel less modern compared to rivals like Tableau.
- Initial setup and customization require specialized expertise.
- Pricing can be opaque, and total cost of ownership varies widely.
4. Looker (part of Google Cloud)
Pros:
- Built for the cloud, with seamless Google Cloud Platform integration.
- Centralized data model (LookML) encourages governance and consistency.
- Strong embedded analytics capabilities.
- Real-time access to data without full ETL pipeline dependency.
Cons:
- Requires familiarity with LookML, a proprietary modeling language.
- Pricing is generally enterprise-focused and not transparent.
- Not as flexible for ad hoc reporting or complex visualizations compared to Tableau or Power BI.
5. InetSoft StyleBI
Pros:
- Schema-less data mashup engine allows agile reporting without data warehouse dependency.
- Highly customizable dashboards with embedded analytics capabilities for OEMs and SaaS providers.
- Lightweight footprint ideal for cloud-native and microservices architectures.
- Affordable pricing for enterprises and ISVs with OEM licensing.
Cons:
- Smaller community and ecosystem compared to giants like Microsoft or Tableau.
- User interface may feel less polished in some areas.
- Initial learning curve for building complex mashups without SQL schemas.
BI Tool Variations
SpreadsheetsBI tools come in many different shapes and sizes. The simplest BI tool and cog in the realm of business intelligence is spreadsheets. Spreadsheets are used to collate data into a meaningful form, but quickly become overwhelming.
Spreadsheets store a large amount of information but can be very difficult navigate at times. This is why, although they are technically BI tools themselves, organizations typically employ a more advanced, more user-friendly alternative.
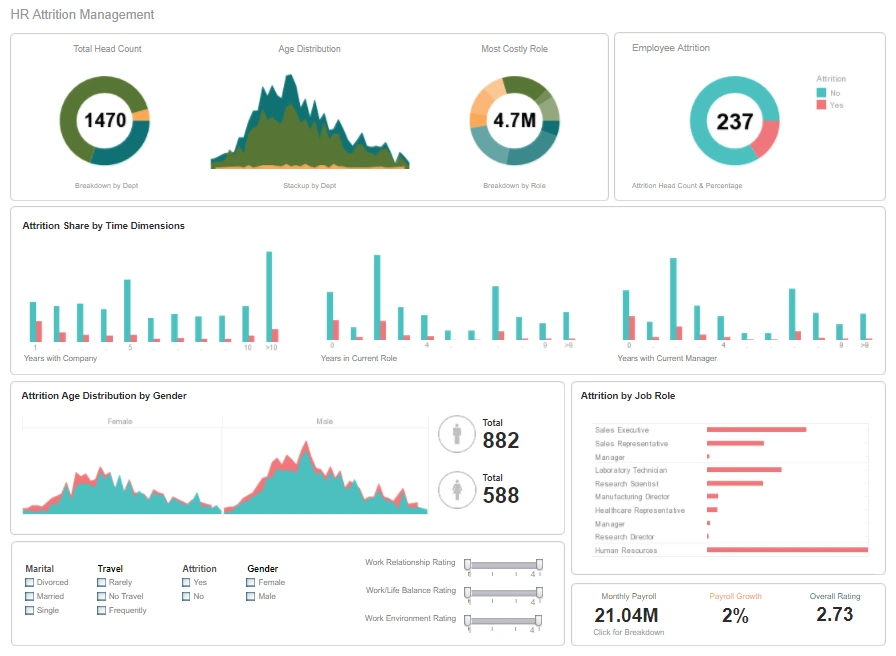
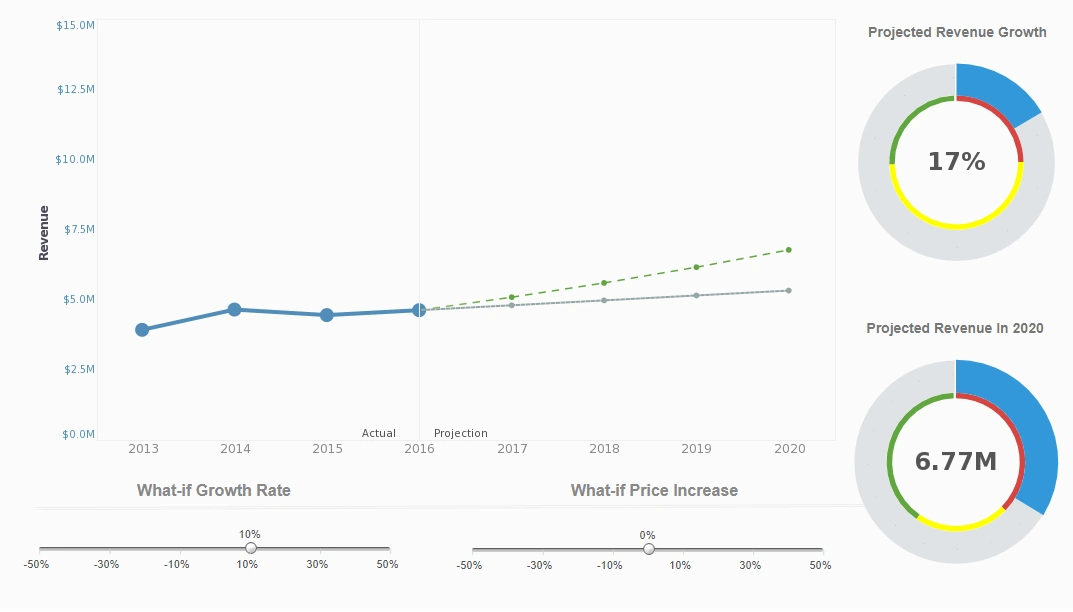
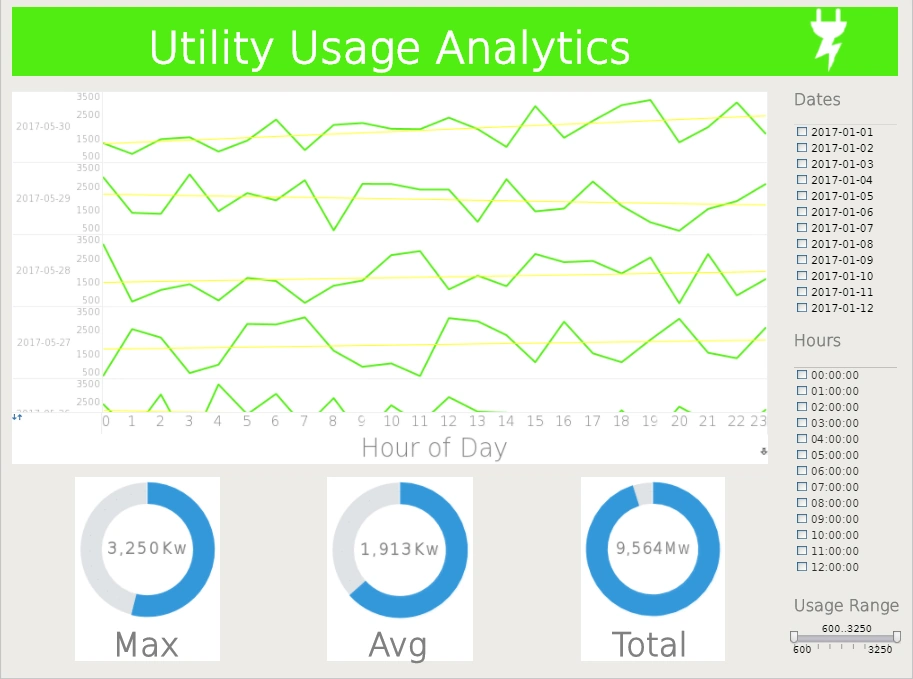
DashboardsDashboard reporting tools offer managers a convenient tool for monitoring their company's performance. They act as a control center for a company, facilitating a 360 degree view of all key business metrics.
Unlike a control center, however, dashboards are a much more portable solution. Dashboard tools can be embedded into existing software or exist as stand alone products. The most transportable dashboard tools are entirely Web-based. Dashboards can be used to identify strengths and weaknesses of an business, run multiple reports simultaneously, and show new trends.
Data miningData mining is the process of analyzing data from different perspectives and summarizing it into useful information that can be used to increase revenue and cut costs.
Companies use data mining to sift through data for market research, report creation, and report analysis. Technology innovation continuously increases capacity for analysis while driving down costs. Associations and correlations lead to discovery of information useful to a business. Sales, stock, shipping, and any other number of factors can tell a story and influence managers' decisions.
And many, many more...Why InetSoft?
InetSoft offers BI tools for dashboards, analysis, and reporting that are easy, agile, and robust. InetSoft's flagship product, StyleBI™, goes beyond traditional BI tools by providing a complete BI software platform which includes fine-grained security and administration for accessing diverse data sources. In addition to pixel-perfect report publication, this advanced BI platform offers powerful yet easy-to-use Web-based applications for dashboard creation and interactive visual analysis.
A key InetSoft mission is to enable maximum end-user self-service. From the company's inception 15 years ago, InetSoft has sought to empower businesses and their staff with unfettered access to BI technology, and has challenged the artificial conventions and obstacles that previously hindered adoption of BI software by some organizations.

InetSoft is a pioneer in data mashup and offers a unique capability of end-user defined data mashup, which means even business users can combine fields from different data sources that were not previously modeled, and even import external data sources such as spreadsheets, to create a new dashboard or report to be shared in the BI environment. The end result is maximum self-service.
InetSoft's BI tool addresses the need for rapid integration of data sources by supporting full end-user data mashup. This means that end-users, on their own, can combine diverse data sources to create automatically updating reports and dashboards, and can share these easily with others in the organization, all from within the primary BI software application.