Using Images to Chart Data - Example and How to Create
This page explains how you can use images to chart data in an InetSoft chart. This page also provides access to a free online tool for creating charts and complete functioning business intelligence dashboards.
Contents
What is an Image Chart?
Prerequisites for Using Images
How to Create a Chart Using Images
Tool to Make Image Charts Online for Free

Definition of an Image Chart
An image chart is simply a chart that incorporates image files into the data display, augmenting or replacing the normal chart elements such as bars, points, or lines. The use of images within a chart can often make the chart easier to read, more meaningful to users, or simply aid in branding and marketing the material to an intended audience.
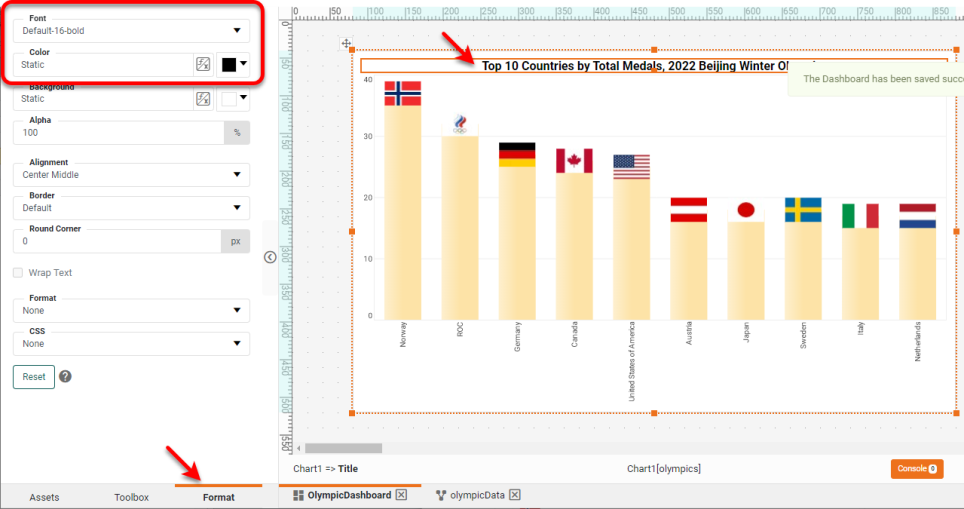
The chart above is an elementary bar chart displaying Olympic medal results, but is enhanced by using the flags of the participating countries as the data points. This transforms a pedestrian bar chart into a more interesting visual experience. Generally, including visuals in any chart or diagram can simplify comprehension. Therefore, when working in block diagram programs or chart generation, do your best to supplement statistical data with pictures.
Prerequisites for Using Images
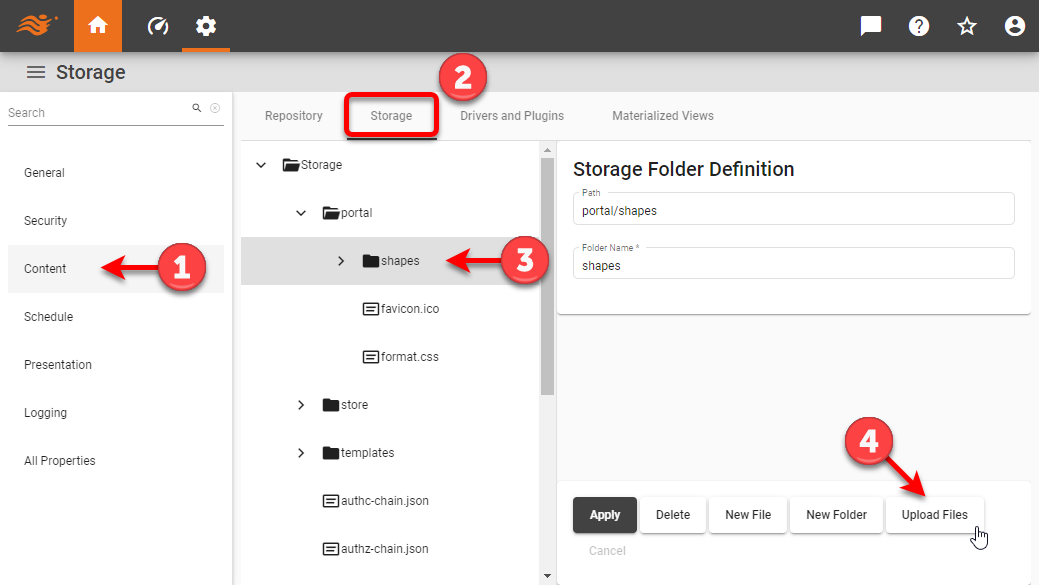
Image charts are very simple to create, but in order to incorporate images in your chart, you or an administrator must first upload the desired images to the InetSoft server. Using the Enterprise Manager administration tool, open the Storage tab on the Content page. Open the portal/shapes folder and then press the Upload Files button to upload the images that you plan to use in the Chart.
How to Create a Chart Using Images
Begin by importing the data set into a Data Worksheet (or by setting up a data source). The sample data we use here is from the Olympics Website and has this form:
This data set contains the medal results for various countries in the 2022 Winter Olympics. The fields are 'Country', 'Gold', 'Silver', 'Bronze', and 'Total'. We will create a chart showing the total medals won by each country, using the country's flag as the data point.
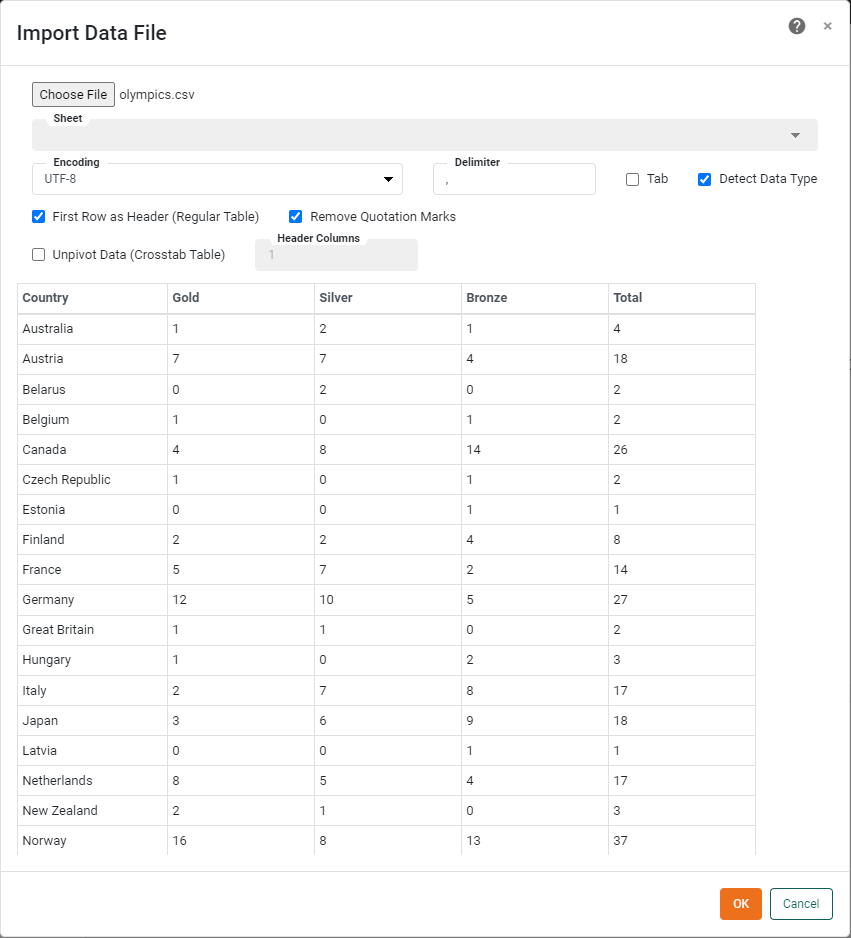
The numerical columns are, from left to right, the number of gold medals, silver medals, bronze medals, and total medals. For this example, we are only interested in the total.
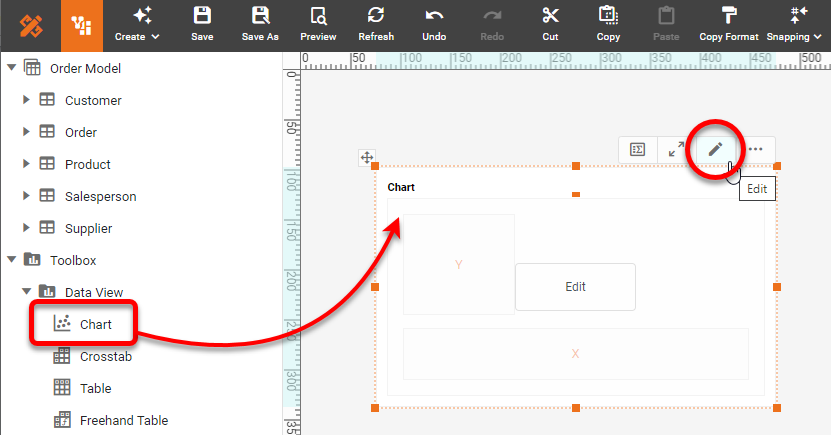
To create the image chart, drag a Chart component from the Toolbox panel into a dashboard in Visual Composer, and then press the Edit button to open the Chart Editor.
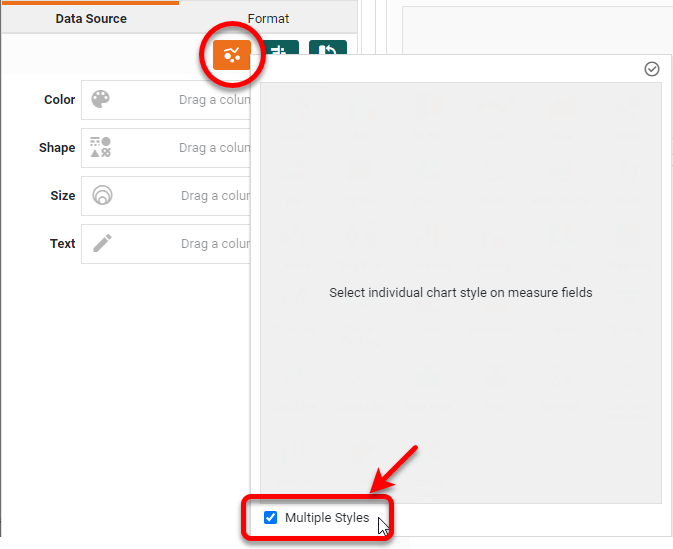
In the Chart Editor, set the Chart Style to Multiple Styles.
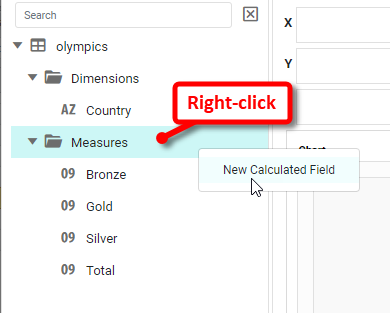
Since we want to have the measure represented both by a bar and by a point (the image), we will create a duplicate measure. In the Data Source panel, right-click the Measures folder, and select New Calculated Field.
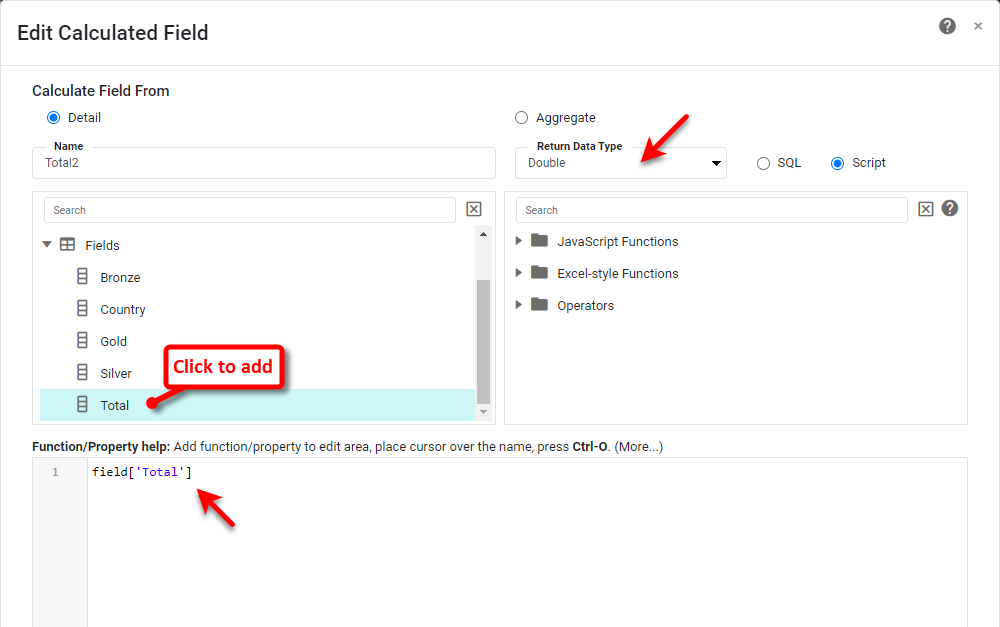
In the Edit Calculated Field dialog box, enter the name "Total2", set the Return Data Type to 'Double', and click the 'Total' field to enter it into the expression. Then press OK. This creates a duplicate measure field.
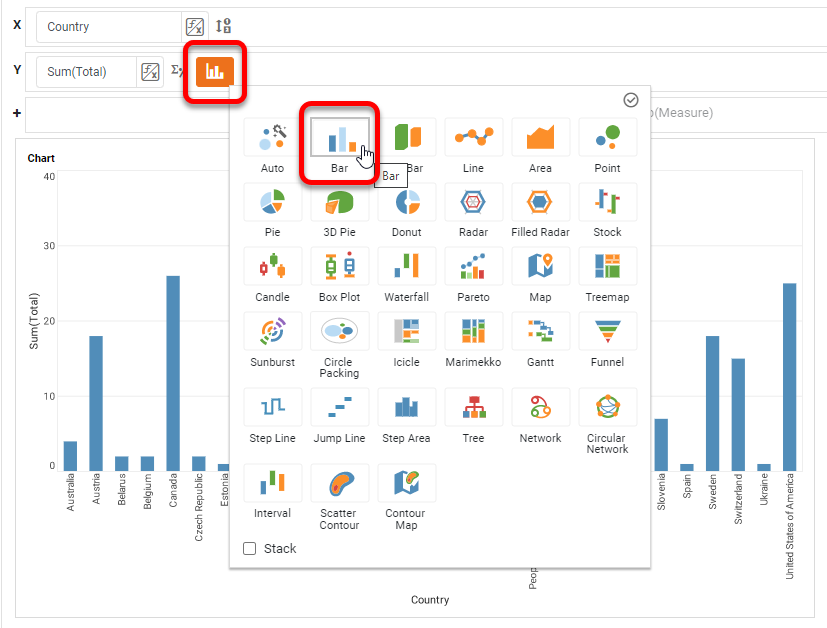
Drag the 'Total' measure to the Y region in the Chart Editor. Drag 'Country' field to the X region. Press the Select Chart Style button next to the measure, and choose Bar.
Press the Edit Dimension button next to 'Country' and set the Rank condition to Top 10 of Sum(Total). Press Apply.
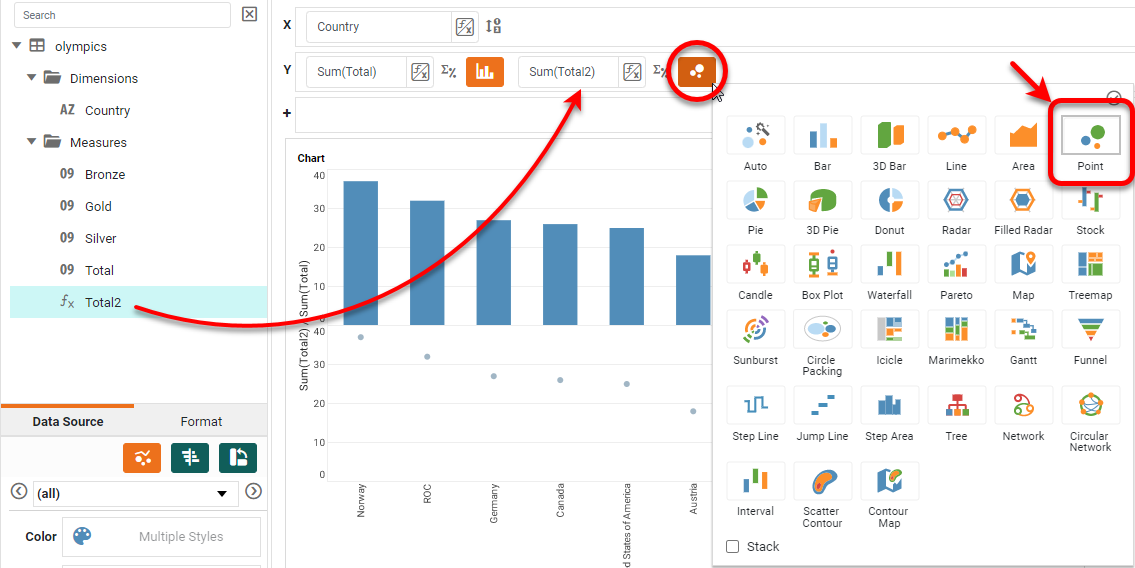
Drag the 'Total2' field to the Y region and set a Point type chart style.
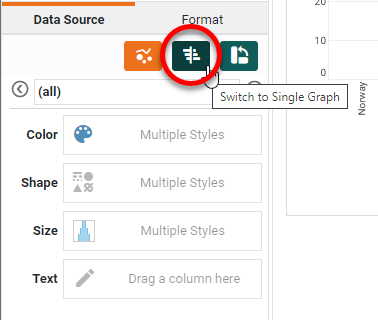
Press the Switch to Single Graph button.
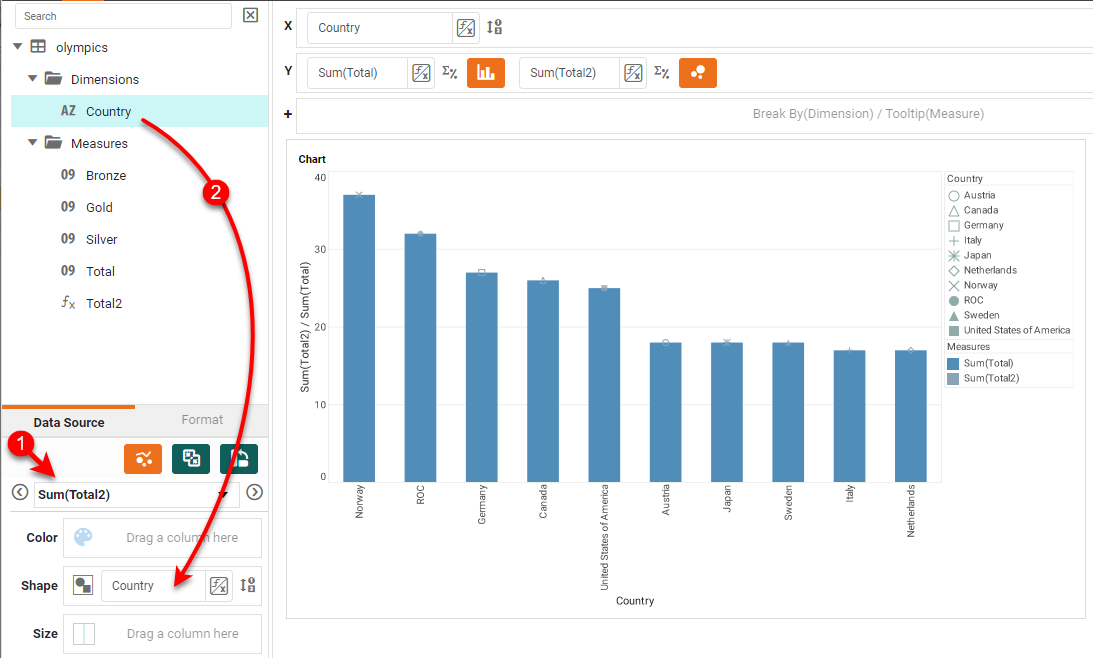
Select Sum(Total2) from the menu in the bottom left panel, and then drag the 'Country' field to the Shape region.
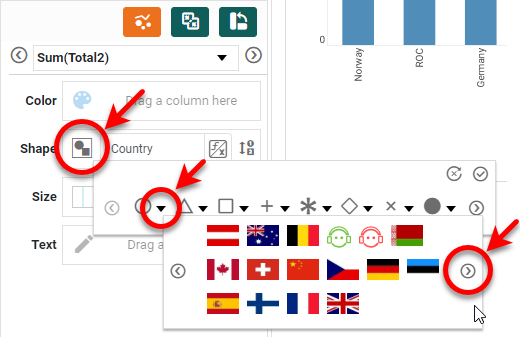
Press the Edit Shape button, and press the first shape drop-down to select the desired flag image. You may need to page through several panes of shapes to find the uploaded images.
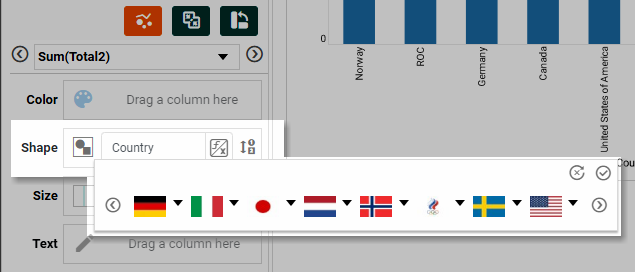
Assign all the desired images to the points in this way and press Apply.
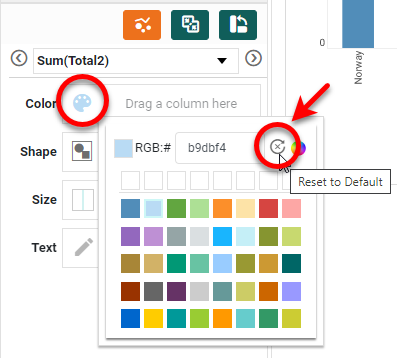
To correct the flag color, press the Edit Color button and then press Reset to Default.
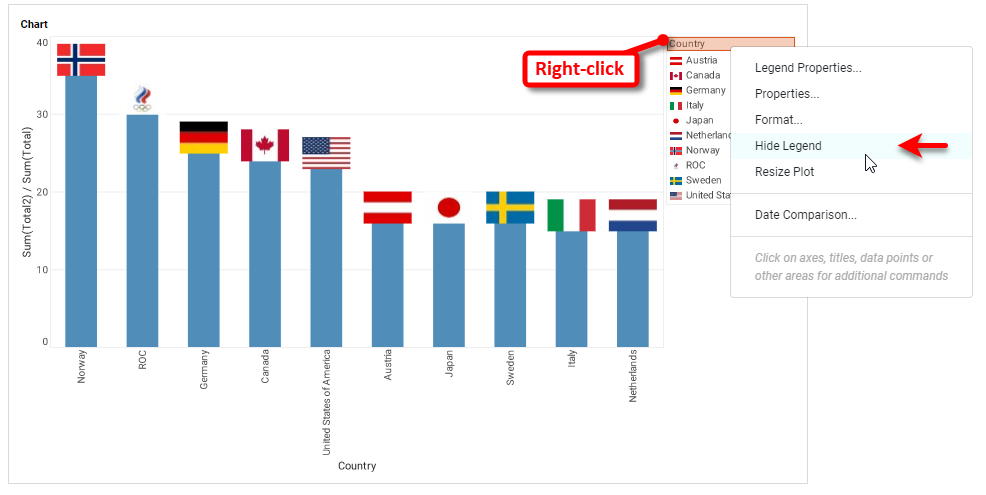
There is no need for the legend in this chart, since the country labels are on the axis, so right-click the legend and select Hide Legend. If there is a legend for the measures, hide that one as well.
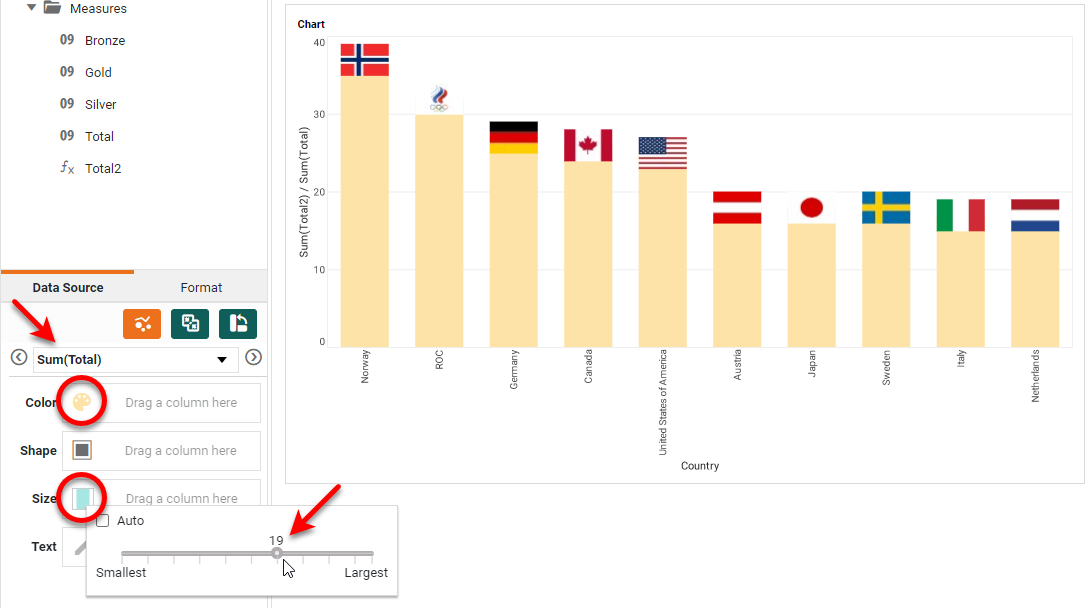
Select the Sum(Total) measure in the menu of the bottom panel. Then press the Edit Color button and set a gold color for the bars. Press the Edit Size button and choose as size that lets the bars match the width of the flag images.
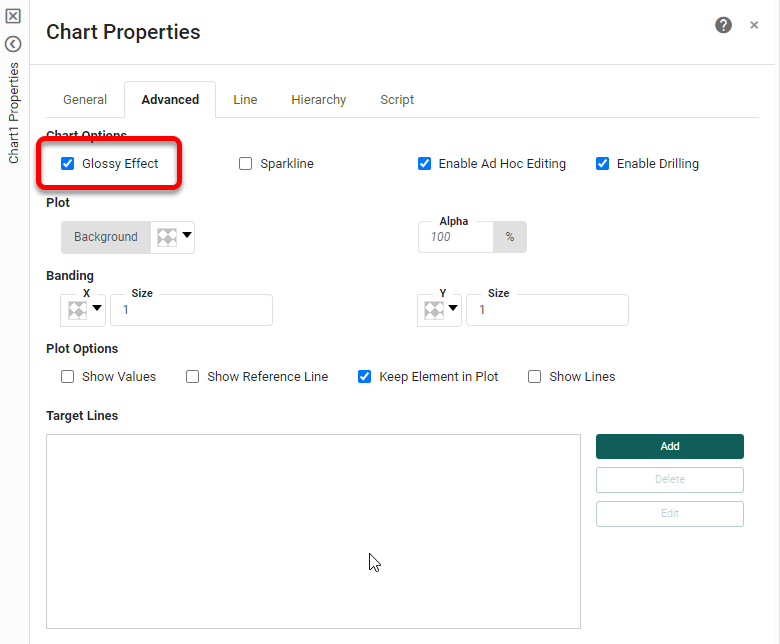
Press Finish to exit the Chart Editor. Now there are just a few final touches: Right-click both the X and Y axis titles and select Hide Title. Right-click the chart and select Properties. Select the Advanced tab, choose the Glossy Effect, and press OK.
Double-click the chart title and add some appropriate text. Use the Format tab to style the title text:
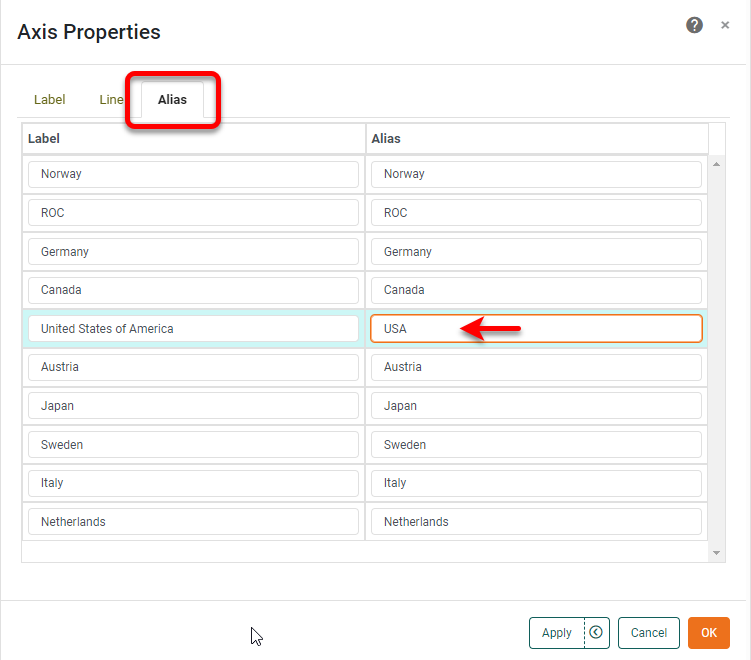
Finally, note that the 'United States Of America' label is far longer than any of the others and looks odd for this reason. Right-click on the axis labels and select Axis Properties from the menu. Select the Alias tab, and change the label to 'USA', then press OK.
Tool to Make Charts Online for Free
To easily and quickly create charts online for free, create a Free Individual Account on the InetSoft website. You will then be able to upload a text data set, as shown below:
