Advantages of Web-Based Business Intelligence
Web-based business intelligence offers several large advantages over its desktop-based or fat-client counterparts.
The standardization of the cloud infrastructure across all organizations and the centralization of software platforms heighten the benefits of Web-based applications to IT departments.
Usability and general familiarity also make end-user adoption more plausible. Furthermore, the ability to utilize Web-based platforms to bring about a centralized environment for reporting and analysis makes the execution of Web-based BI attractive to many organizations.
An online-only application avoids the manpower cost of support desktop software for dozen, hundreds, or even thousands of users. When all those involved work with the same software it becomes easier to support users with queries or concerns.
Web-based tools offer the ability to share information with any number of end users, be they in-house or overseas, with minimal labor. These reports are usually in the form of dashboards and scorecards. They enable users to manage performance, predict future outcomes, and process any number of other business functions.


Why Choose InetSoft?
In order to stand out from the crowd, InetSoft's StyleBI platform presents several innovations on the average Web-based business intelligence model. Being accessible by anyone with a browser and a password, InetSoft's reporting and analysis tool will allow users to access their desired information on the go through internet-enabled cell phones, tablets, and any number of other mobile devices. This includes iDevices due to the fact that StyleBI is a 100% java-based application and does not require Flash.
InetSoft StyleBI is an operational business intelligence platform that features a powerful data mashup engine for the creation of dashboards, visual analyses, and reporting. The unified, easy-to-deploy, easy-to-use business intelligence solution maximizes self-service and serves both enterprises and solution providers.
InetSoft's BI software leverages a powerful patent-pending Data Block™ foundation for real-time data mashup and presents information through interactive dashboards, enterprise reporting, scorecards, and exception alerts.
In contrast to other business intelligence applications that provide only reporting, or only dashboards, or require an intermediate data access layer, InetSoft's business intelligence system is complete. It includes analytics software and sophisticated reporting capabilities plus direct access to almost any data source.
The small footprint, SOA and Java architecture delivers an embedding and integration ready platform that delivers analytic business intelligence within business processes.
More Articles About Web-Based Business Intelligence
-
Interactive Web Dashboards
InetSoft’s data visualization software delivers web-based dashboards that are visually compelling and interactive, enhancing user engagement. The platform supports self-service analytics through drag-and-drop data mashups, allowing users to combine data from multiple sources effortlessly. Trusted by over 5,000 organizations globally, it offers robust solutions for diverse industries.
-
Free Visualization Tools
InetSoft provides both free and commercial web-based visualization tools, including Style Scope Free Edition for interactive dashboard creation. The software connects to relational databases and spreadsheets, enabling users to build sophisticated visual analyses. It supports business users and developers with intuitive design interfaces for enhanced productivity.
-
KPI Dashboard Software
InetSoft’s web-based interactive dashboard system simplifies KPI monitoring with easy-to-deploy software. The platform offers visually appealing dashboards with strong analytic and drill-down capabilities, supporting maximum self-service for users. It includes features like real-time data updates and customizable visualizations for business performance tracking.
-
Customizable Web Reports
InetSoft’s web-based reporting tools enable rapid development of customizable reports and dashboards for enterprise needs. The software supports data retrieval from various sources, including databases, cloud warehouses, and REST APIs, with flexible formatting options. Features like report automation and multi-tenancy ensure scalability and secure data sharing across organizations.
-
Cloud-Hosted Visualization
Visualize Free is a web-based, cloud-hosted tool from InetSoft that allows users to create interactive dashboards by uploading spreadsheet data. The platform supports drag-and-drop functionality and shareable links for collaboration, though it has limitations in data and user privileges. Upgrading to commercial offerings provides dedicated servers and advanced data connectivity.
-
Self-Service Dashboarding
InetSoft’s web dashboard application pioneers self-service dashboarding with a user-friendly drag-and-drop designer. It connects to cloud data sources like Salesforce and Google Analytics, supporting both in-cloud and on-premises deployments. The platform’s pricing is competitive with solutions like Power BI, offering robust analytics for businesses.
-
Analytic Dashboard
Solutions
InetSoft’s cloud-flexible analytic dashboard software offers interactive dashboards with pixel-perfect report generation and maximum self-service. The platform supports deployment on various cloud infrastructures or on-premises, with intuitive data mashup capabilities. It is designed for scalability, catering to organizations of all sizes with minimal training required.
-
Pioneering Dashboard
Reporting
InetSoft’s data visualization dashboard software produces web-based dashboards with an intuitive drag-and-drop interface for rapid deployment. The platform’s Data Block™ technology enables user-driven data mashups, enhancing self-service analytics. It is trusted by 25% of Fortune 500 companies for its visually compelling and interactive solutions.
-
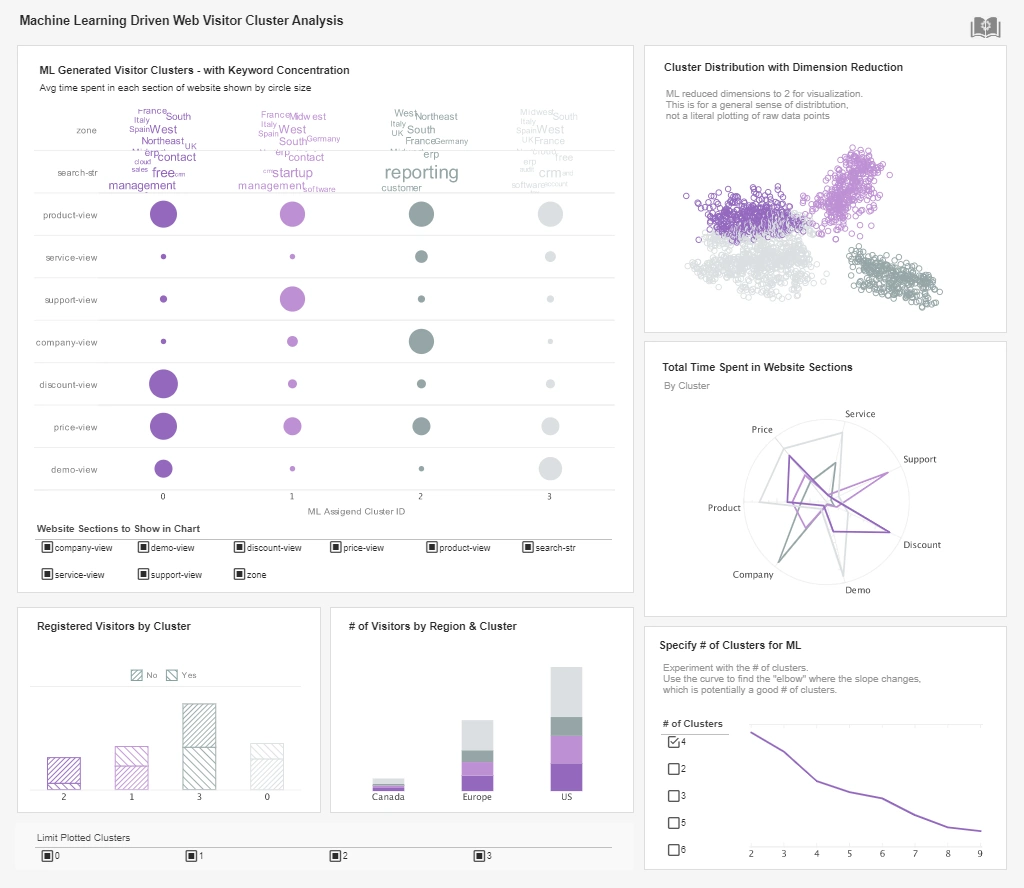
Data Mining Visuals
InetSoft’s data mining visualization software leverages web-based interactive dashboards to analyze trends and correlations across multiple data sources. The platform’s high-definition graphics and Data Block™ technology enable exploratory data analysis for competitive insights. It supports real-time data exploration, making it a powerful tool for modern businesses.
-
Web-Based Dashboard Software
InetSoft’s digital dashboard solution offers web-based software that enterprises can deploy quickly and embed into applications. The platform features interactive visualizations and self-service analytics, supported by a drag-and-drop designer. It is praised for its ease of use and ability to integrate with various data sources for comprehensive insights.