What Is KPI Decomposition?
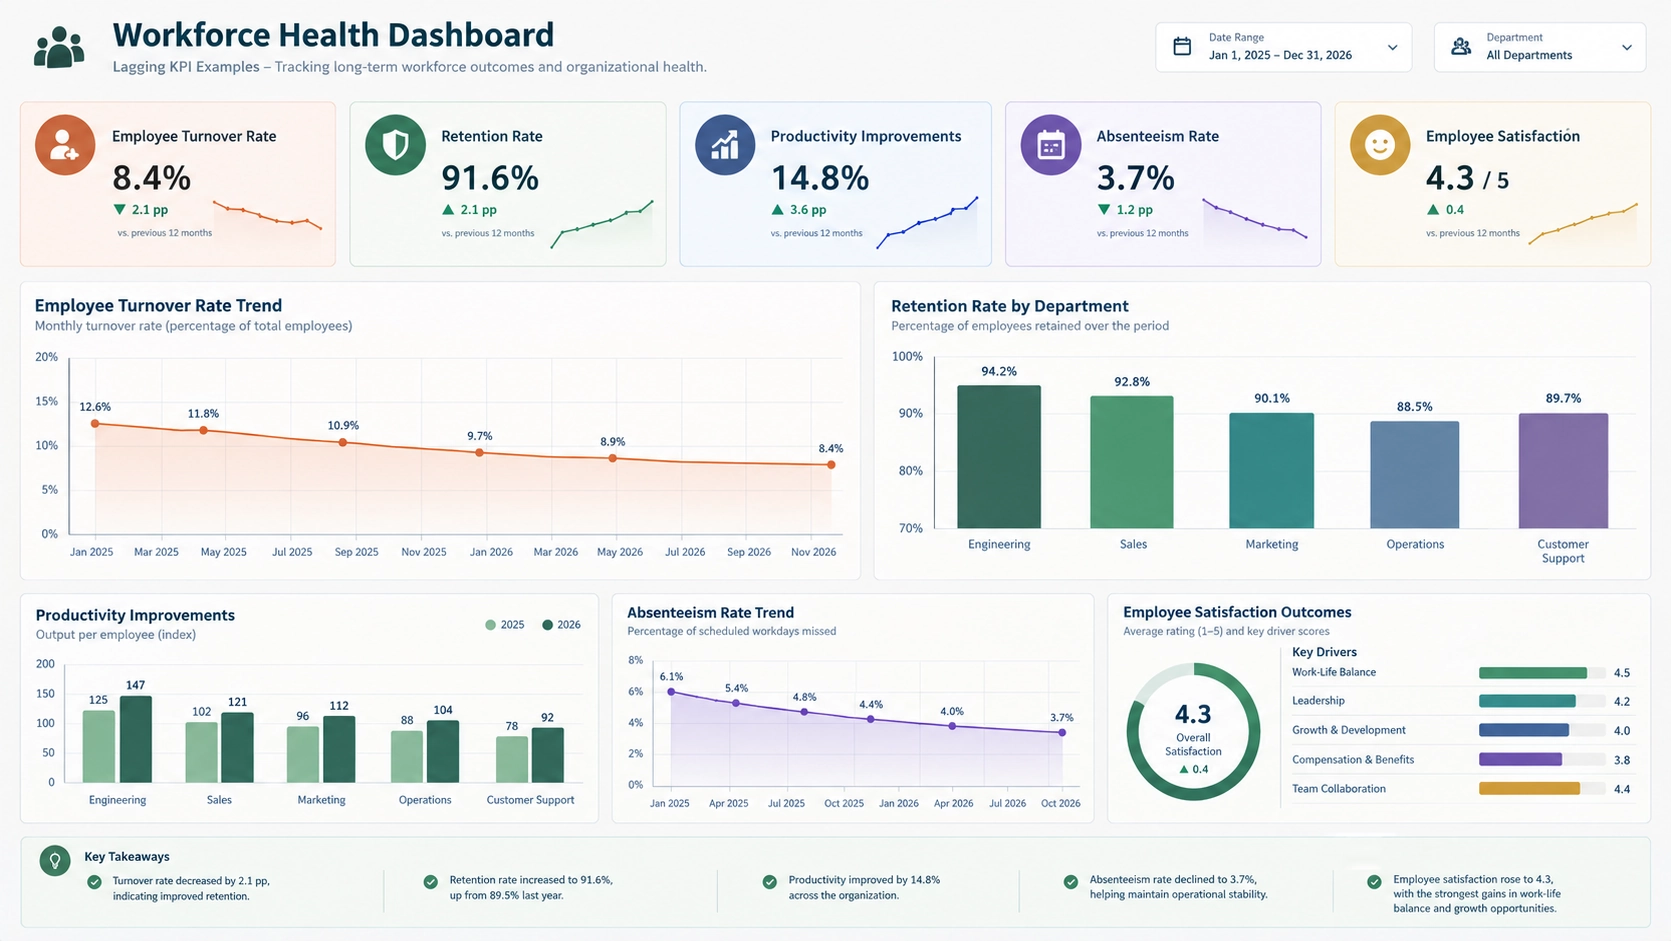
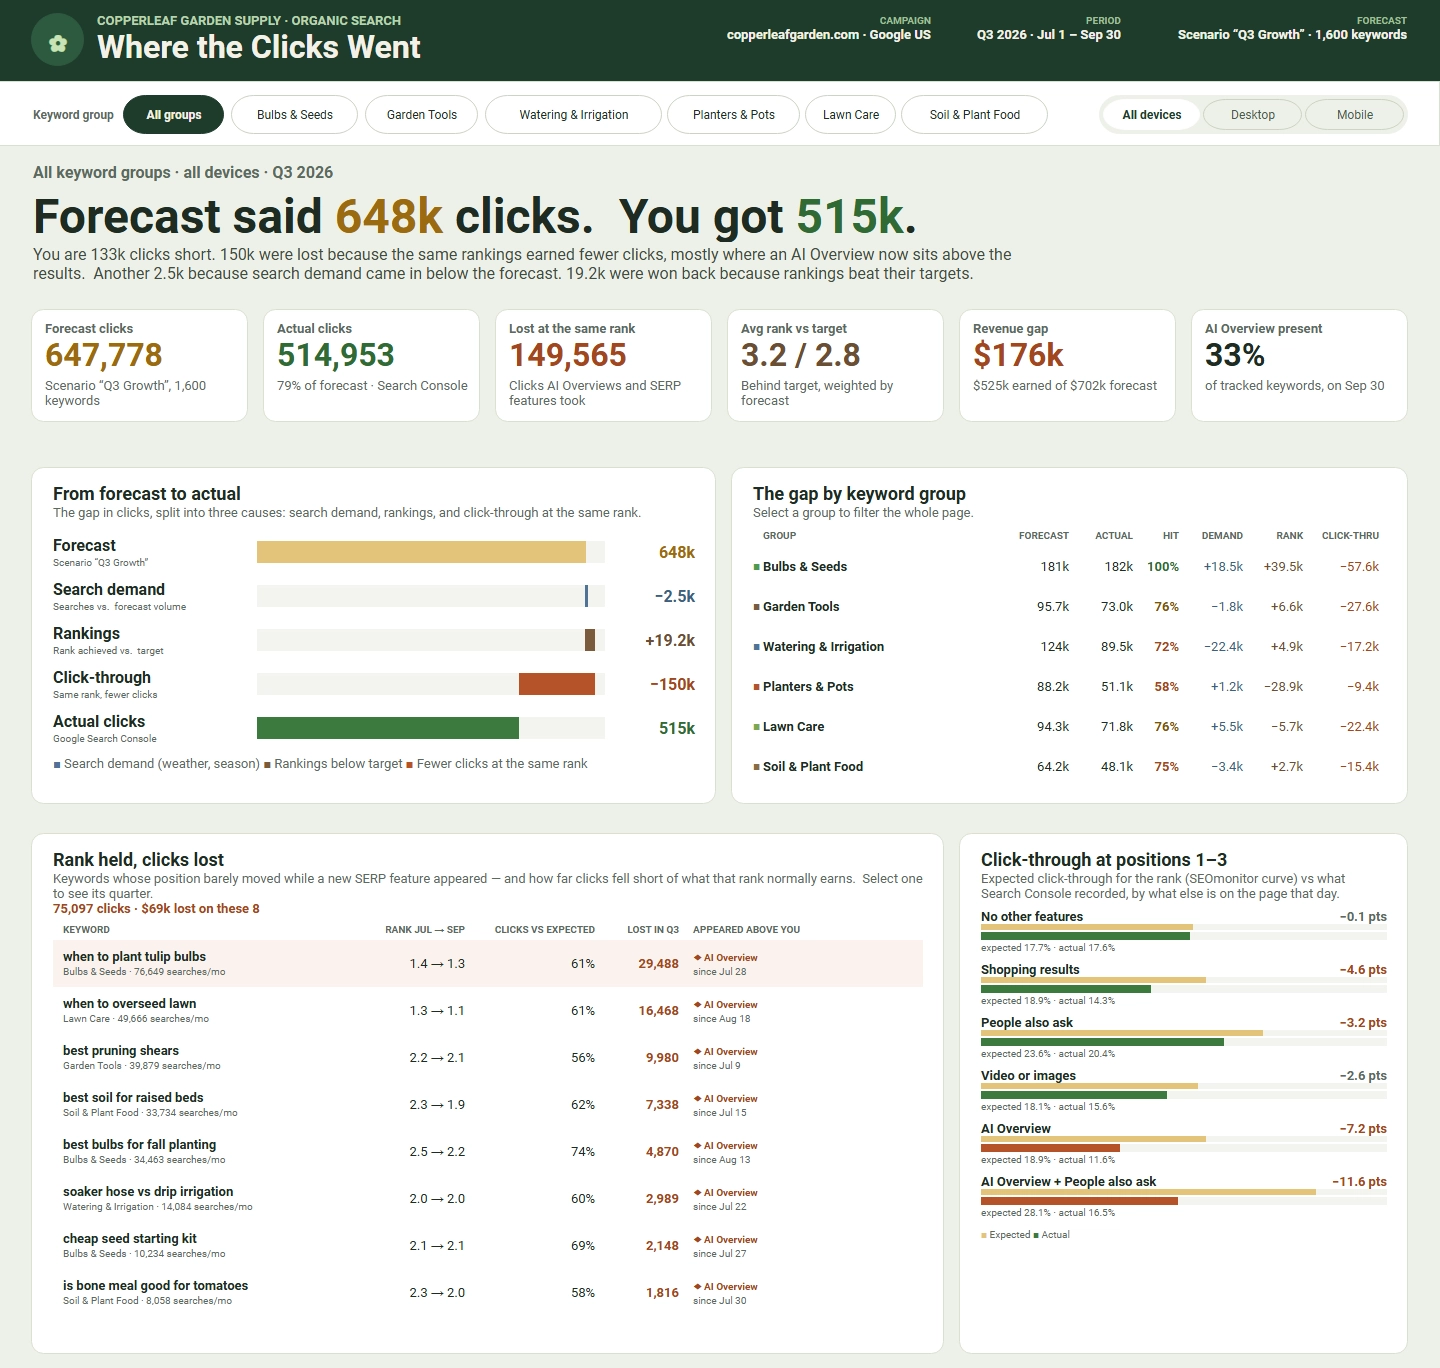
KPI decomposition is the process of breaking down a high-level Key Performance Indicator (KPI) into smaller contributing metrics to understand what factors are driving performance.
Rather than simply knowing that a KPI has increased or decreased, decomposition allows organizations to discover the underlying causes behind those changes.

Why KPI Decomposition Matters
Executives often monitor broad business metrics such as revenue, profit margin, customer retention, production efficiency, or customer satisfaction. While these KPIs show overall performance, they do not explain why performance changed.
KPI decomposition provides a structured way to investigate contributing factors by breaking a KPI into measurable components. This approach helps decision-makers move beyond observing problems and begin solving them.
For example, if revenue declines by 12%, management needs to know whether the change was caused by lower customer volume, reduced average order value, pricing changes, regional performance issues, or shifts in product demand.
How KPI Decomposition Works
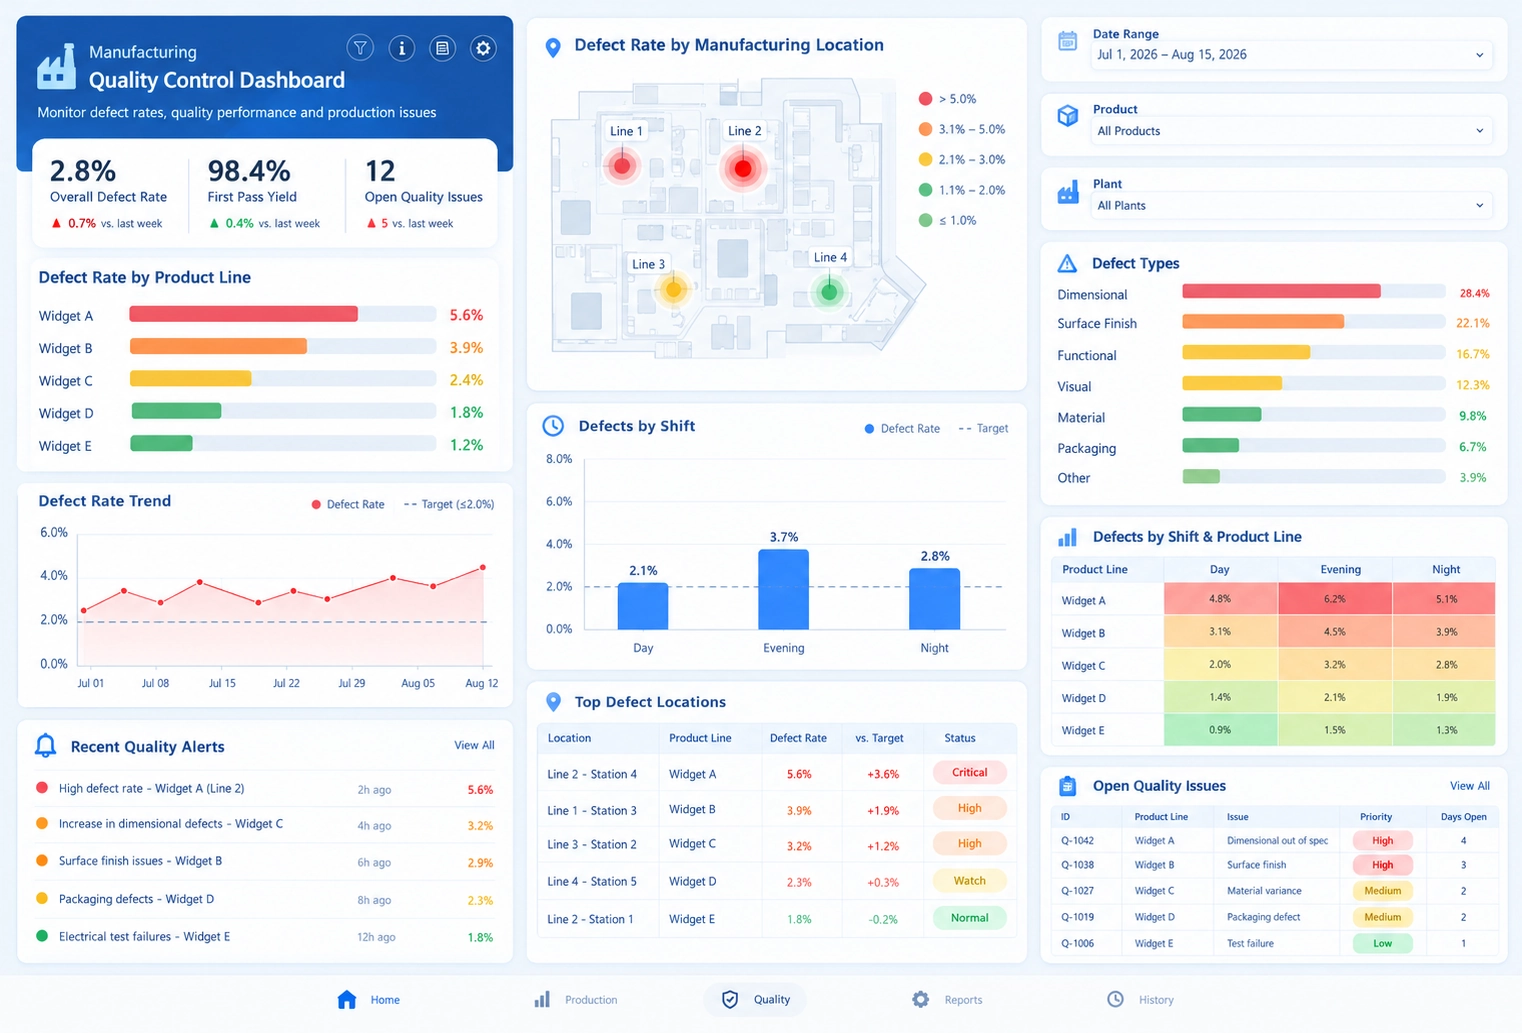
KPI decomposition follows a hierarchical analysis process. Analysts begin with a top-level KPI and progressively break it into smaller metrics until root causes become visible.
Example: Revenue Decomposition
A company discovers that quarterly revenue is under target.
- Total Revenue
- Revenue by Region
- Revenue by Product Line
- Revenue by Customer Segment
- Average Transaction Size
- Number of Orders
Further decomposition may reveal that decreasing revenue originates from one specific region, product category, or customer group, making corrective action significantly easier.
What Is a KPI Decomposition Tree?
A KPI decomposition tree is a visual analytics structure that displays a KPI and its contributing metrics in a branching hierarchy. Users can interactively expand nodes to explore deeper levels of detail.
Modern business intelligence platforms use decomposition trees to support guided root cause analysis. Users can quickly navigate from executive-level metrics to operational drivers without building multiple reports.
A decomposition tree for customer churn might look like:
- Customer Churn Rate
- Region
- Industry
- Customer Size
- Product Type
- Subscription Length
Common KPI Decomposition Use Cases
Sales Performance Analysis
Organizations decompose sales KPIs to identify underperforming territories, sales representatives, industries, products, or customer segments.
Customer Retention Analysis
Customer retention metrics can be broken down by demographics, customer value, subscription plans, regions, and support interactions to determine churn drivers.
Manufacturing Performance
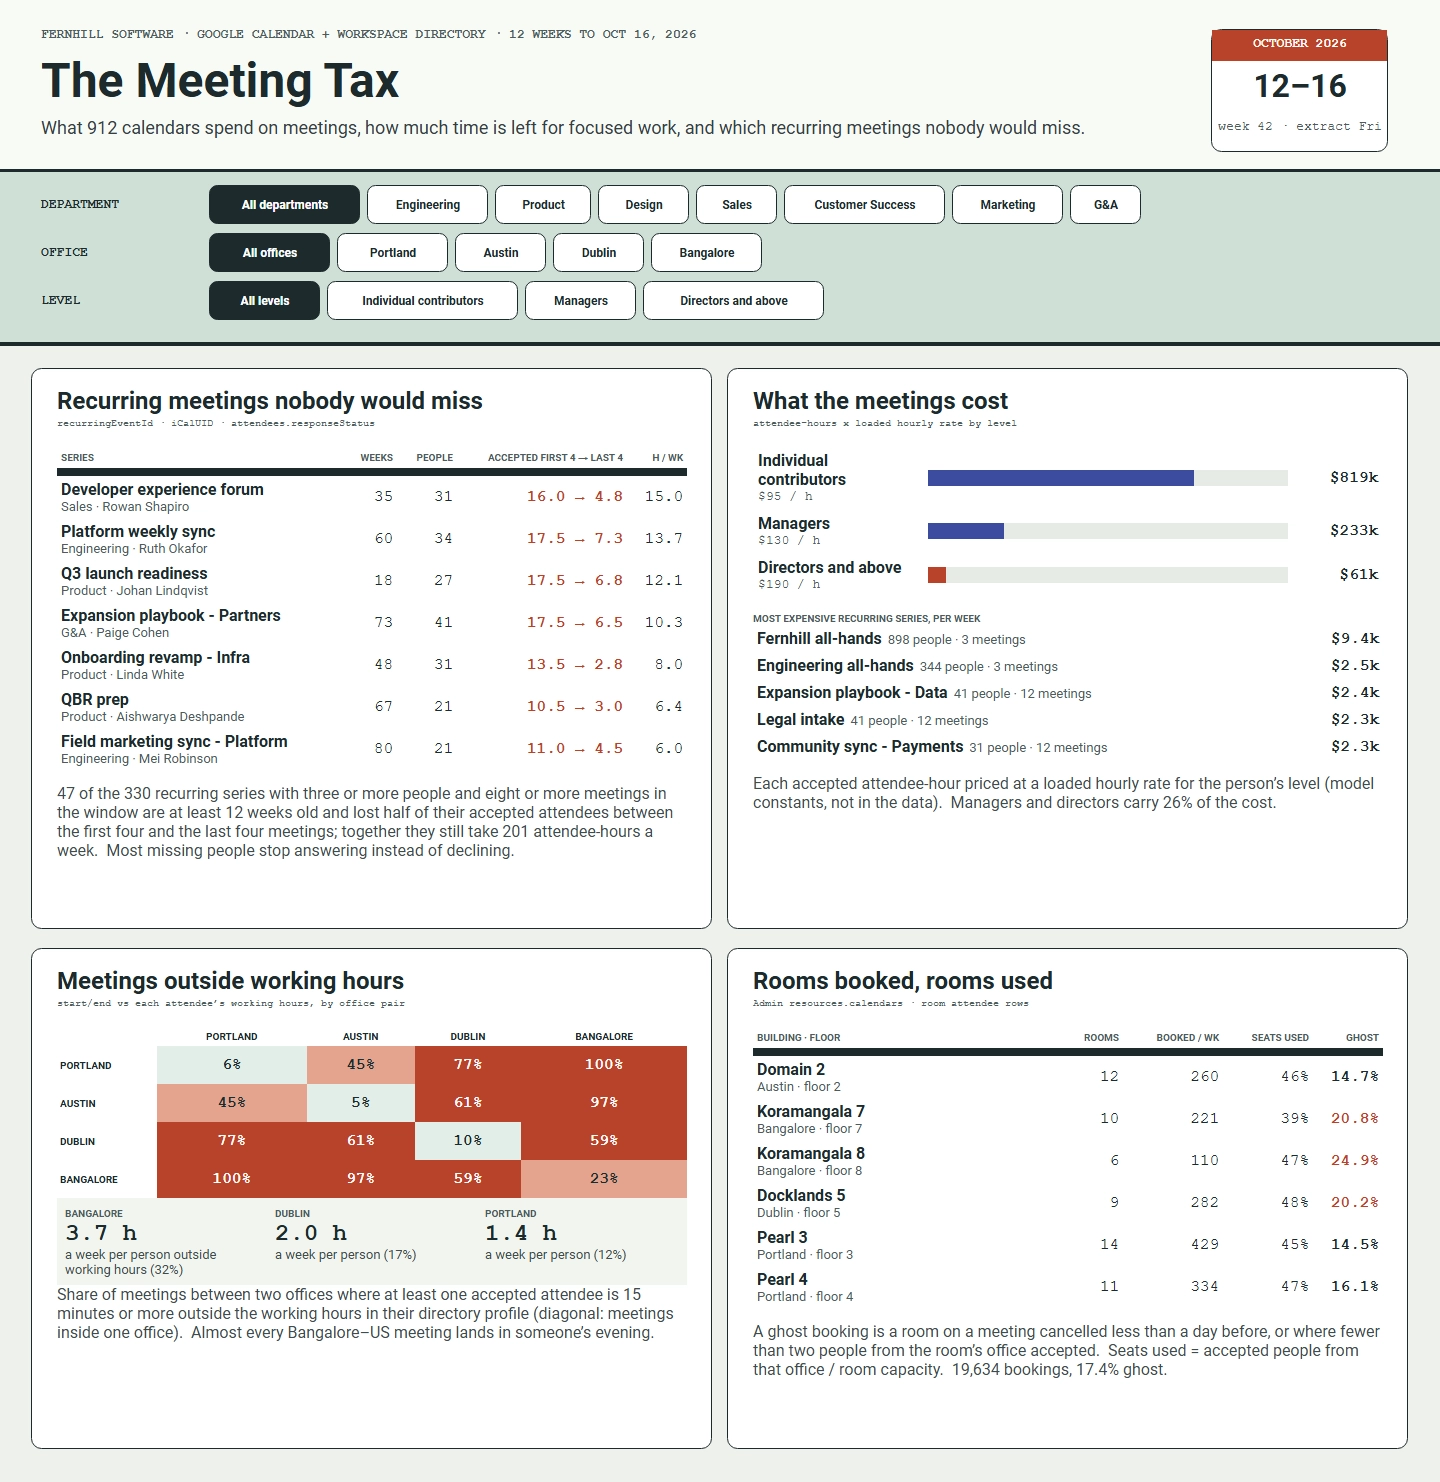
Manufacturers use decomposition analysis to understand yield issues, production delays, downtime causes, and efficiency variations across facilities.
Marketing Performance
Marketing teams decompose campaign KPIs into channel performance, audience segments, geographic regions, and conversion stages to optimize spending.
Benefits of KPI Decomposition
- Provides clear root cause visibility.
- Accelerates decision-making.
- Reduces time spent creating ad hoc reports.
- Improves accountability by identifying performance drivers.
- Supports data-driven management practices.
- Helps prioritize corrective actions.
- Improves forecasting accuracy.
- Reveals hidden business patterns.
Real-World Example
A retail chain notices that same-store sales growth has fallen below target. Instead of accepting the KPI at face value, analysts decompose the metric into individual stores, product categories, customer segments, and promotional campaigns.
The analysis reveals that most stores are performing well, but one region is experiencing reduced traffic due to increased local competition. Armed with this insight, management launches targeted promotions and adjusts inventory strategies specifically within affected locations.
Without KPI decomposition, the organization may have implemented broad company-wide changes that failed to address the true source of the problem.
KPI Decomposition in Business Intelligence Dashboards
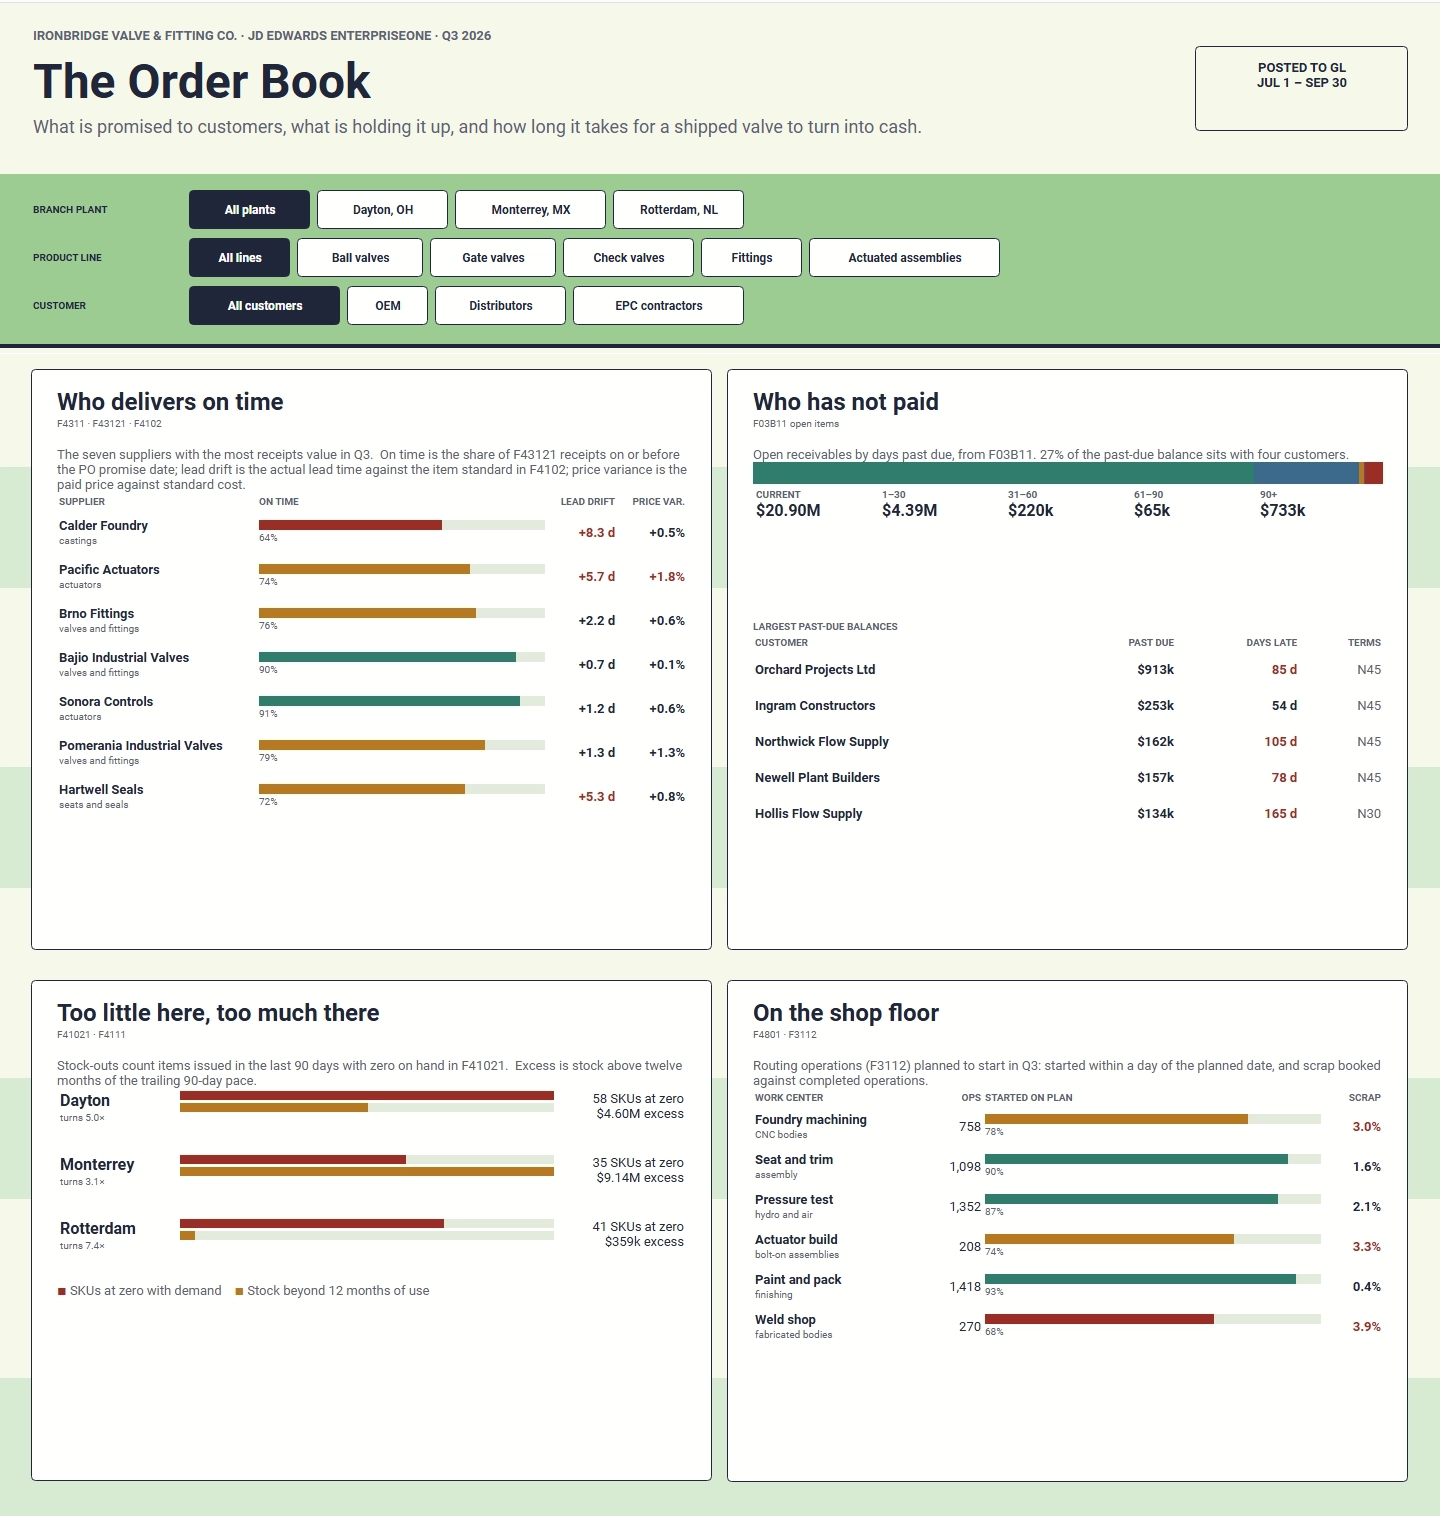
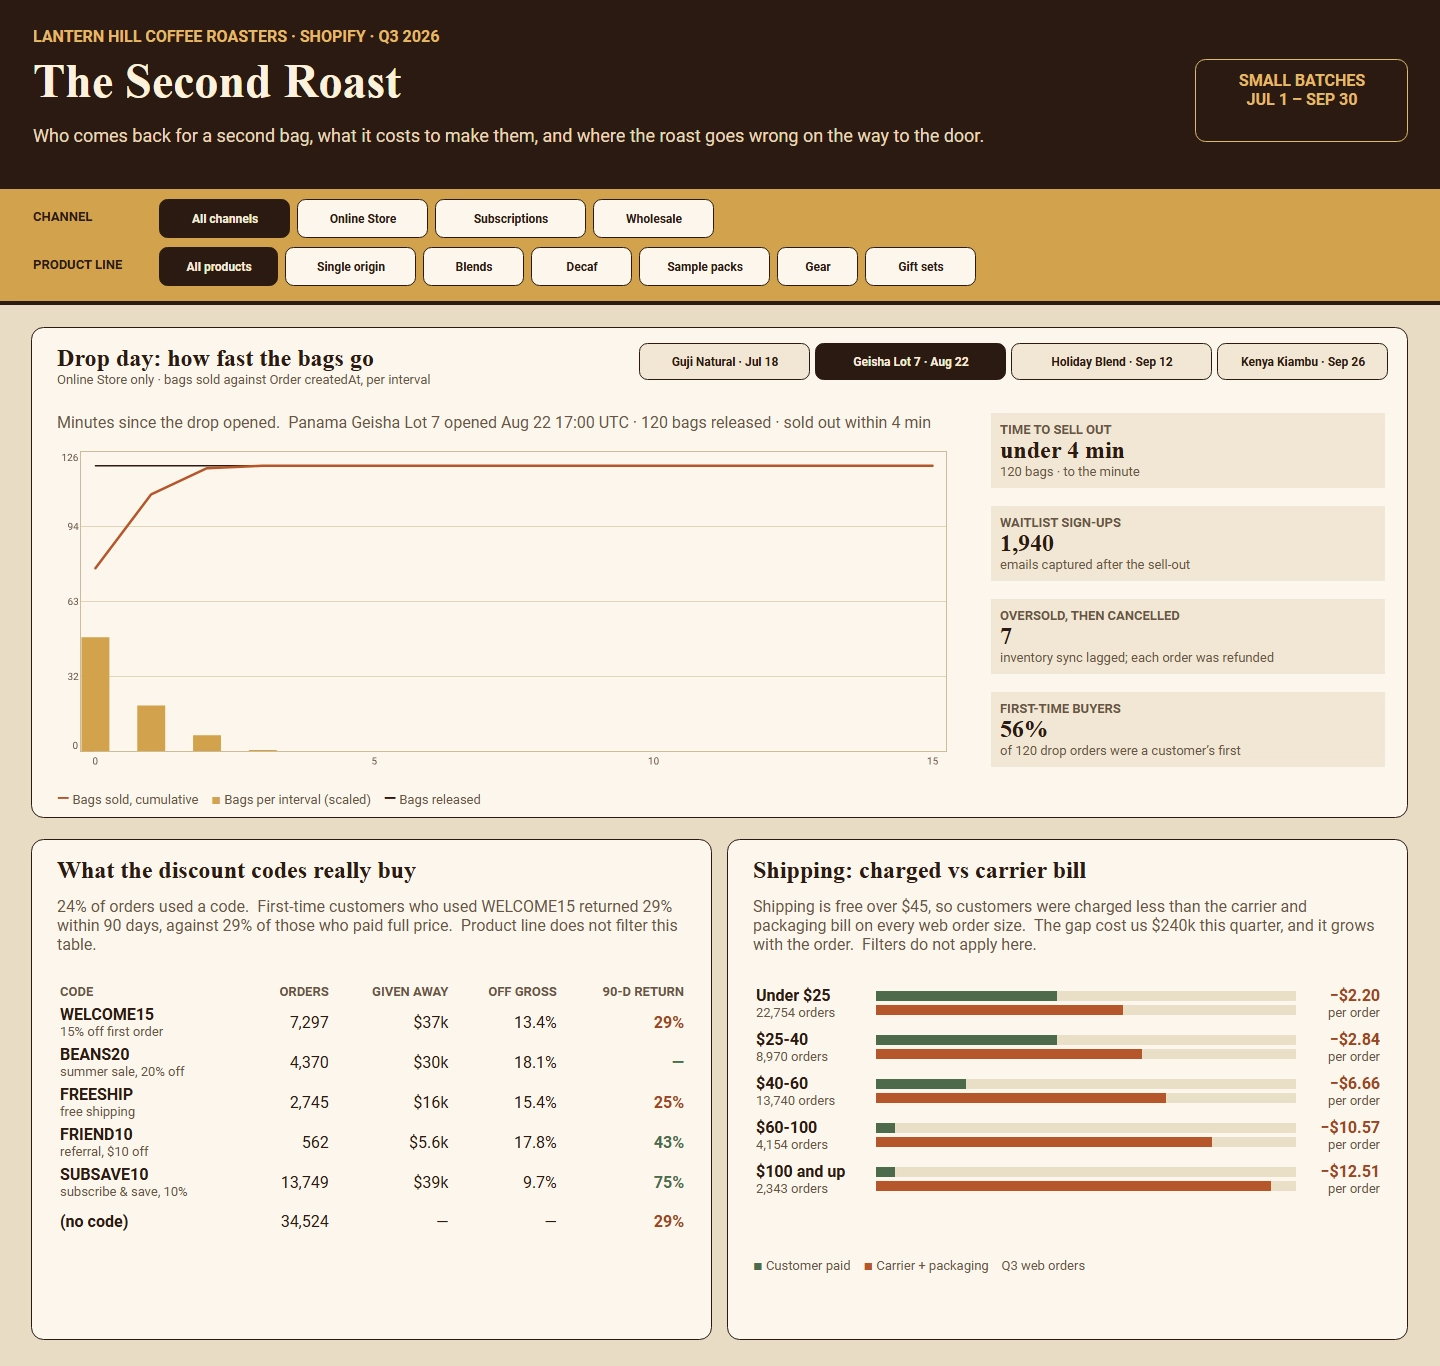
Business intelligence applications often integrate decomposition capabilities directly into dashboards. Users can click on a KPI and drill into contributing dimensions such as geography, products, departments, sales channels, or time periods.
Platforms such as InetSoft StyleBI allow organizations to create interactive dashboards that support multidimensional KPI exploration, enabling managers to transition from monitoring performance to identifying actionable causes in a single analytical environment.
Best Practices for KPI Decomposition
- Start with strategic business KPIs.
- Define clear metric relationships.
- Limit decomposition levels to maintain clarity.
- Use visual decomposition trees when possible.
- Combine decomposition with trend analysis.
- Monitor both leading and lagging indicators.
- Automate analysis through dashboard tools.
Transforms Performance Measurement
KPI decomposition is a business analysis technique that breaks high-level performance indicators into contributing metrics to reveal underlying drivers. By helping organizations understand why a KPI changes rather than simply observing the change, decomposition improves root cause analysis, strategic planning, operational efficiency, and decision-making.
Whether analyzing revenue, customer retention, operational efficiency, or profitability, KPI decomposition transforms performance measurement into actionable business intelligence.