Landmark Data Visualization Report Debuts
Piscataway, NJ - September 1, 2009 - InetSoft Technology (www.inetsoft.com), an innovator in dashboard, reporting and analysis solutions, today announced its participation in the "Data Visualization - Market Landscape Report" - the first research report of its kind.
This unique report, authored by industry analyst Lyndsay Wise and unveiled today, thoroughly examines the current data visualization market. It provides a complete assessment of the data visualization industry and takes a critical look at many key areas of the data visualization landscape. Some of the goals include helping businesses and organizations understand:
- A description of dashboards and visualization software options and how they are applied within organizations
- How dashboards and visualization solutions fit within the world of business intelligence
- The business value of using dashboards
- The types of solutions available (and the main players)
- How these solutions differ from one another at a high level
In addition to dashboards, the report also looks at charting, analytical offerings, SaaS/On-demand vendors, business performance management tools and more. Overall, 26 vendors participated in the report, including sponsors InetSoft, Dundas Data Visualization, Klipfolio and QlikView.
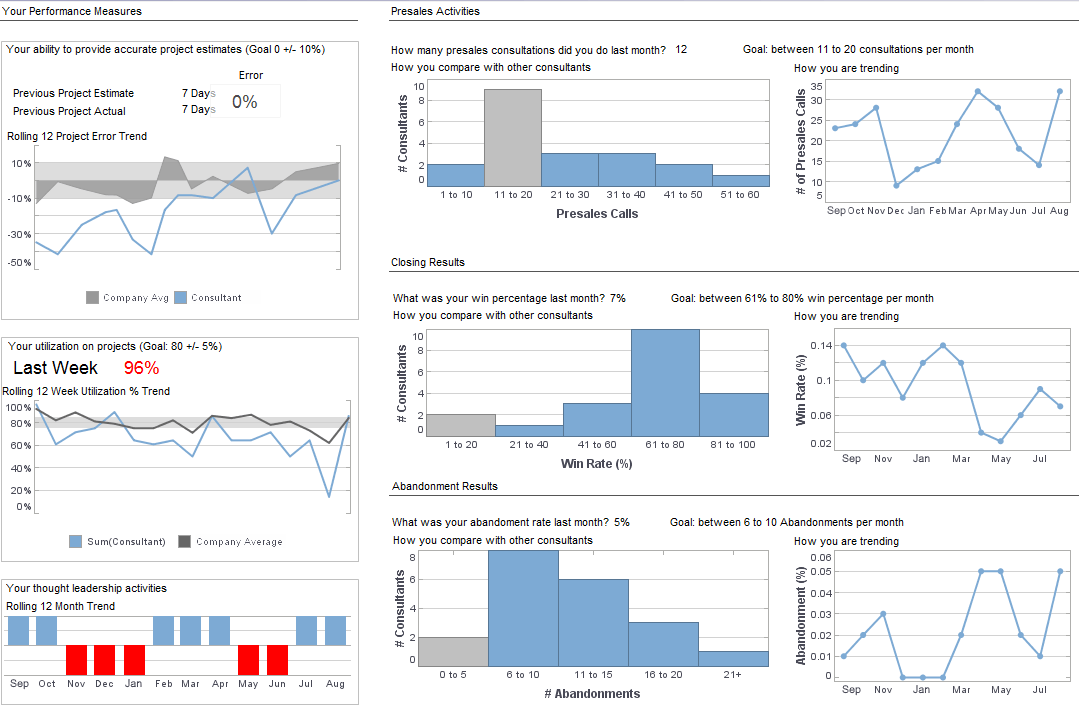
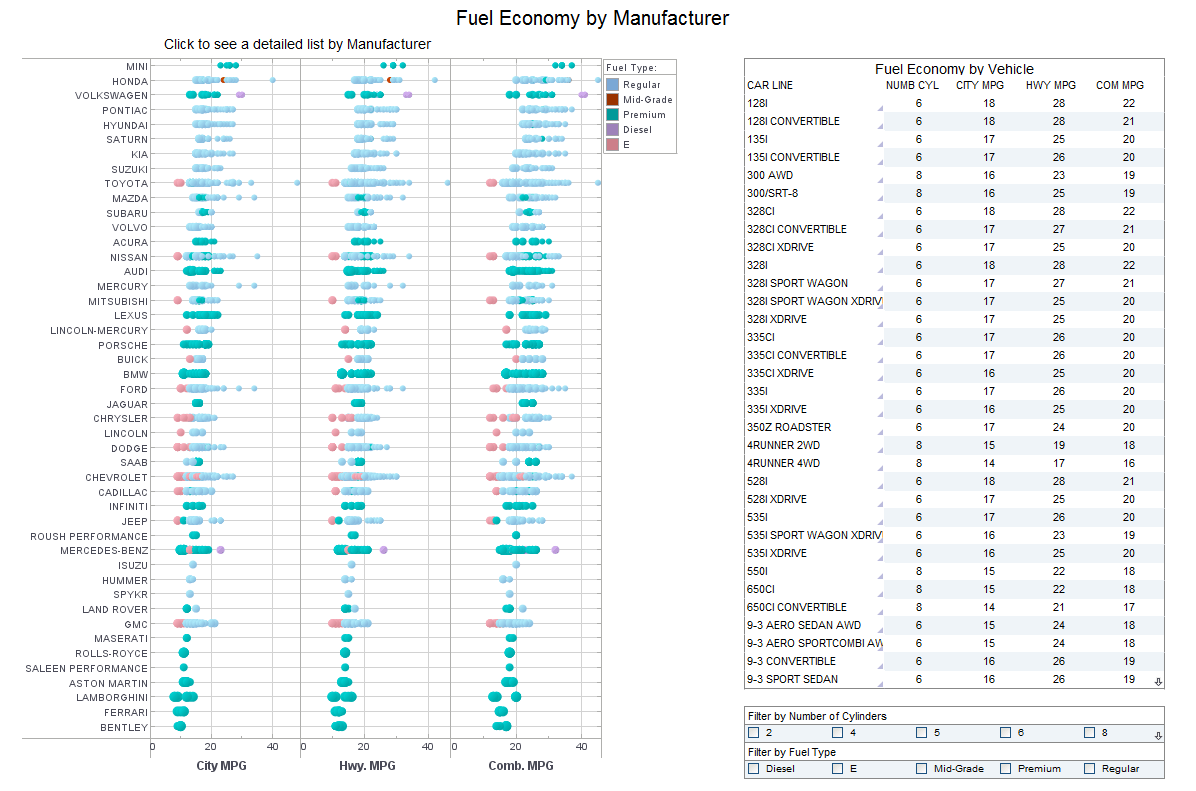
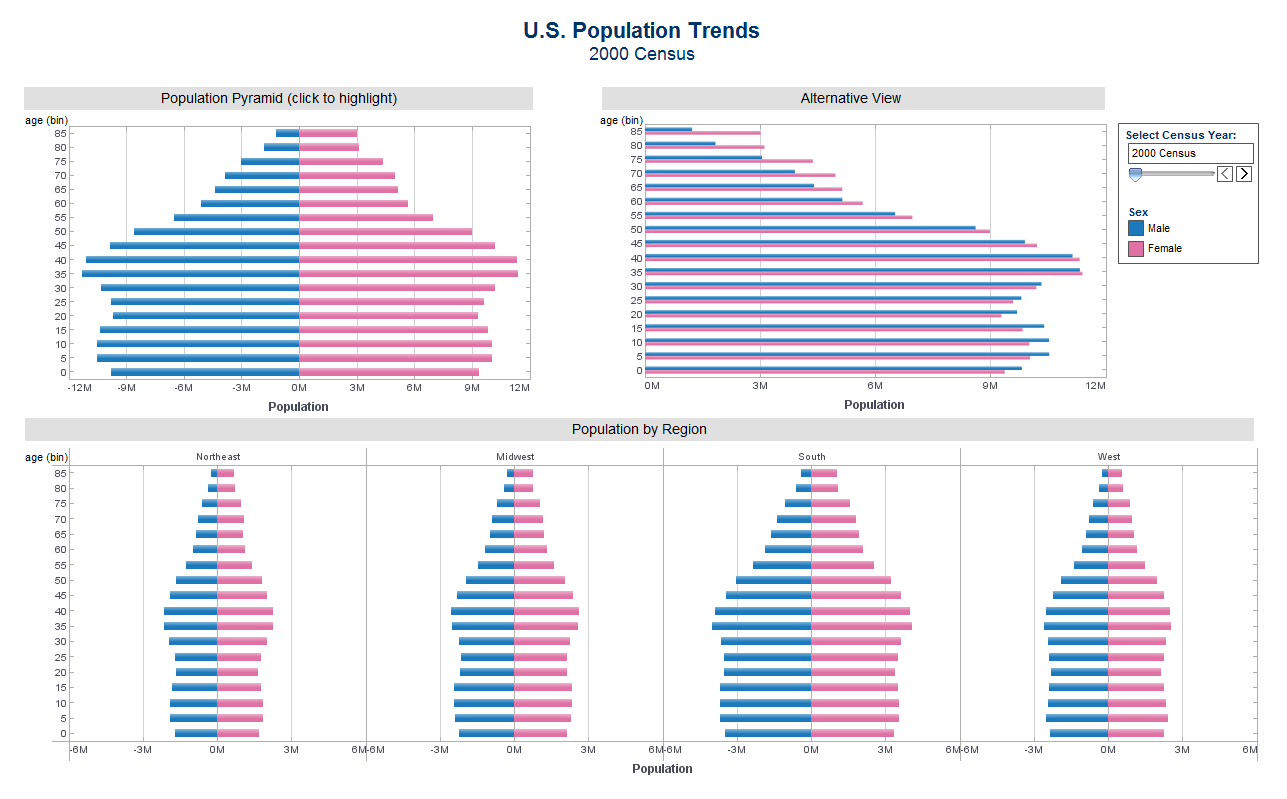
InetSoft recently released a free visualization software application called Visualize Free, which is a derivative of the company’s core commercial product, Style Intelligence. Visualize Free is a free, Web-based visual analysis tool that anyone can use to interactively explore his/her own data using advanced visualization techniques, without IT assistance or the installation of any software.
To try InetSoft’s free visualization software, visit www.visualizefree.com.
Style Intelligence is a full-featured business intelligence solution that is 100% Java at the server level and HTML, JavaScript, and Flash at the client level, which combined with its SOA architecture and open standards-based technology, makes for an ideal embedding and integration-ready application for dashboards and visualization. End-users get visually compelling, highly interactive access to data, and solution providers get a highly customizable, quick to learn and quick to deploy business intelligence toolset and information delivery platform.
About The Author
Lyndsay Wise is president of WiseAnalytics, a boutique analyst firm that conducts research and provides consulting and advisory services to organizations looking to implement business intelligence solutions. She is a monthly columnist for B-eye-Network and Dashboard Insight and conducts research into leading technologies, BI products and vendors, marketing performance management, master data management, and unstructured data.
About InetSoft
Since 1996 InetSoft has been delivering easy, agile, and robust business intelligence software that make it possible for organizations and solution providers of all sizes to deploy or embed full-featured business intelligence solutions. Application highlights include visually-compelling and interactive dashboards that ensure greater end-user adoption plus pixel-perfect report generation, scheduling, and bursting. InetSoft's patent pending Data Block™ technology enables productive reuse of queries and a unique capability for end-user defined data mashup. This capability combined with efficient information access enabled by InetSoft's visual analysis technologies allows maximum self-service that benefits the average business user, the IT administrator, and the developer. InetSoft solutions have been deployed at over 3,000 organizations worldwide, including 25% of Fortune 500 companies, spanning all types of industries.
Contact
For more information, media and analysts may contact:
Mark Flaherty
InetSoft Technology Corp.
+1.732.424.0400 x 936
mark.flaherty@inetsoft.com
www.inetsoft.com
Visualization Examples


