Agribusiness Software Reporting Solution
AgKnowledge is an industry leading, cloud based Agribusiness SaaS solution for medium and small fresh fruit and vegetable producers and distributers, originally created by TechKnowledge Associates, Inc., an industry leading supplier of Agribusiness software and services to medium and small fresh fruit and vegetable producers and distributors.
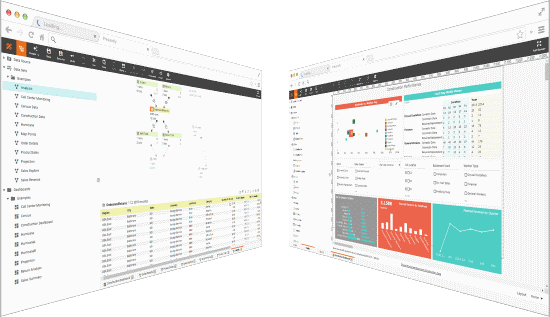
AgKnowledge emnbedded InetSoft's advanced dashboard and reporting capabilities, enabling users to visualize and analyze their agribusiness data more effectively. The integration allowed for reusable data models, saving time and effort for both AgKnowledge and its clients. Additionally, InetSoft's tools empowered clients to create custom dashboards and automate report scheduling, enhancing overall productivity.

InetSoft Powered Dashboards and Data Management
The AgKnowledge user portal utilizes InetSoft's StyleBI to provide dashboards and reports, and to provide data models which save time since they can be reused for different clients.
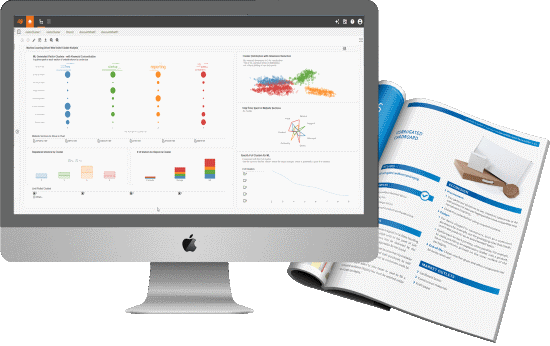
While some AgKnowledge clients are happy with simple reports that they can filter and export raw data from, AgKnowledge's more involved clients enjoy learning how to build their own agribusiness dashboards. This hands on approach is enabled by the InetSoft data worksheet interface. Data tables in the Agknowledge database often have an overwhelming number of fields, with names that are not very descriptive. DID data scientists rectify this issue by creating data worksheets with only columns included that the client will want to use, with descriptive names assigned to the columns.
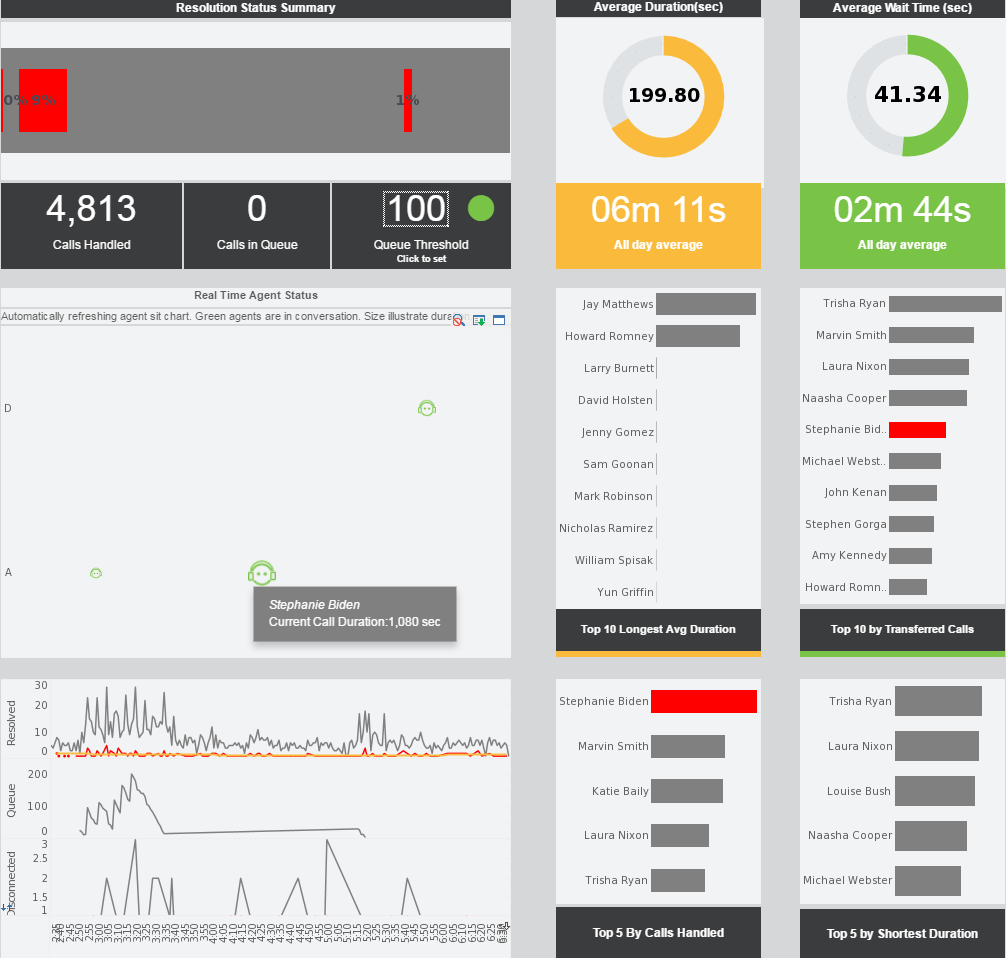
Another features that DiD data scientists have widely used is the ability to schedule reports or taks, and have them run autonomously and export the results via email. That's a big deal for many AgKnowledge clients. They also enjoy the ability to bookmark a report or dashboard in a specific way, so they can just open it every day, see what they've saved the day before, and make desired changes.
Examples of Dashboards Made for AgKnowledge Clients
- Crop Investments Over Time
- Payroll Broken Down by Operation
- Trays of Product Recieved by Lot and Grower
Benefits of AgKnowledge Agribusiness Solution
Save Time
AgKnowledge runs in the cloud, making it quick and easy to get started. Clients enter information once and it automatically feeds all parts of their business. The AgKnowledge Trading Partner module automatically exchanges information with other AgKnowledge clients and eliminates "double-entry".
Access Anywhere
It's not necessary to be in the office to access AgKnowledge, making opening new locations and offices easy. All devices are supported — if the client has access to the internet, they are good to go.
Customized to Client Needs
AgKnowledge is controlled by rules and options that can be set so that it runs just the way the client wants. If they need custom programming, DiD is ready, willing and able to make the changes requested.
To read a detailed case study of Did Integration's integration of InetSoft click here.
What Are the Metrics Tracked in Agribusiness — What They Mean and How to Affect Them
Agribusiness blends biology, logistics, markets and management. Measuring performance means tracking a mix of agronomic, financial, operational, and sustainability metrics. Below I outline the most important metrics, what each actually measures, why it matters, and practical levers managers can use to influence them.
1. Yield (per hectare / acre)
What it is: Quantity of crop produced per unit area (e.g., tonnes/hectare, bushels/acre). It’s the headline agronomic performance metric.
Why it matters: Yield directly drives revenue for commodity crops and underpins unit economics for processing and feed supply.
How to affect it: Improve seed genetics and planting density, optimize nutrient programs based on soil tests, improve irrigation scheduling, reduce pest and disease pressure through integrated pest management (IPM), and use precision agriculture (variable-rate application, remote sensing) to match inputs to field variability. Good farm records and timely field operations (planting window, harvest timing) also increase realized yield.
2. Total Production (volume)
What it is: Absolute output across farms or a business unit (e.g., total tonnes harvested per season).
Why it matters: Shows scale and capacity usage; important for processing throughput, contracts, and meeting market commitments.
How to affect it: Expand planted area, improve yield per area, reduce losses (during harvest, transport, storage), or bring more suppliers into your network. Investment in mechanization can increase effective harvested area per day.
3. Unit Cost / Cost of Production (per tonne, per kg, per litre)
What it is: All-in cost to produce one unit of output, including seed, fertiliser, chemicals, labour, fuel, machinery depreciation, irrigation, and overhead.
Why it matters: Determines margin at prevailing prices and helps identify cost reduction opportunities.
How to affect it: Reduce unnecessary inputs via precision ag, negotiate bulk-buy discounts, extend equipment life with maintenance, optimize labour scheduling, and shift to lower-cost but effective practices (e.g., no-till, cover crops). Improving yield often lowers unit cost by spreading fixed costs over more units.
4. Gross Margin and Net Profit
What they are: Gross margin = revenue minus direct production costs. Net profit = margin after all overheads, interest, taxes and exceptional items.
Why they matter: Indicators of economic viability and investment capacity.
How to affect them: Increase prices via product differentiation or quality premiums, reduce costs (see unit cost), hedge price risk with futures or contracts, pursue value-added processing, and optimize crop mix for margin rather than yield alone.
5. Price Received and Price Realization
What it is: The actual price you get for product after discounts, premiums, and marketing costs.
Why it matters: Two farms with the same yield can have very different economics depending on price realization.
How to affect it: Target premium markets (organic, specialty grades), improve post-harvest quality to avoid discounts, use better timing and forward contracting to capture higher prices, and reduce middlemen by selling direct or via cooperatives.

6. Input Use Efficiency (Fertiliser, Water, Energy)
What it is: Output per unit of input — e.g., kg yield per kg of nitrogen, kg yield per cubic meter of water.
Why it matters: Critical for cost control, environmental compliance, and sustainability claims.
How to affect it: Precision application (soil mapping, variable-rate), split nutrient applications timed to crop need, fertigation, improved irrigation tech (drip, sensors, deficit irrigation), and energy-efficient machinery or renewable energy integration.
7. Harvest and Post-Harvest Losses
What it is: Percent of production lost during harvest, handling, transport, and storage.
Why it matters: Loss reduction directly increases saleable volume without more land or inputs.
How to affect it: Invest in better harvest equipment and calibration, improve sorting and grading, control temperature and humidity in storage, speed up movement to markets or processors, and train workers in handling best practices.
8. Inventory Turnover (for processed/packaged goods)
What it is: How often inventory is sold and replaced over a period. Low turnover ties up working capital and risks spoilage.
How to affect it: Align production with demand forecasts, use promotions to move slow lines, diversify sales channels, and shorten lead times with better logistics planning.
9. Labour Productivity
What it is: Output per labour hour or per worker.
Why it matters: Labour is often a large recurring cost — especially for harvest and packhouse operations.
How to affect it: Mechanization, better crew supervision and incentives, training, improved workflows, and seasonal staffing strategies. Technology (field apps, digital work orders) reduces idle time and errors.
10. Crop Health and Disease Incidence
What it is: Measures of pest/disease pressure (incidence, severity) or plant health indices from remote sensing (NDVI, canopy cover).
How to affect it: Regular scouting, crop rotation, resistant varieties, balanced nutrition, timely interventions guided by thresholds, and biological controls. Early detection via drones or satellite reduces spread and treatment costs.

11. Soil Health Metrics (Organic Matter, pH, CEC)
What it is: Laboratory measures indicating soil fertility and long-term productivity potential.
How to affect it: Add organic amendments, adopt cover crops, reduce tillage, apply lime to correct pH, and monitor trends with regular soil testing to move from reactive to preventive fertility management.
12. Water Use Efficiency and Irrigation Reliability
What it is: Crop produced per unit of water, and reliability of water supply (hours/days available).
How to affect it: Shift to efficient systems (drip), use soil moisture sensors, schedule irrigation on crop demand, implement on-farm storage, and pursue water-saving cropping choices during shortages.
13. Sustainability and Compliance Metrics (GHG per tonne, Chemical Use)
What it is: Emissions intensity, pesticide residue levels, certification indicators (e.g., GLOBALG.A.P.), and other environmental/social KPIs.
Why it matters: Increasing buyer and regulatory demand for traceability and lower environmental impact directly affects market access and price premiums.
How to affect it: Adopt emissions-reducing practices (reduced tillage, optimized fertilizer to cut nitrous oxide), transition to less hazardous chemicals, audit the supply chain, and pursue certifications that open premium channels.
14. Market and Contract Coverage Metrics (Forward Cover, Contract Fulfilment)
What it is: Percent of expected production already sold/hedged and the rate of on-time contract fulfilment.
How to affect it: Use hedging, forward contracts, and diversify buyers. Improve forecasting and logistics to meet commitments and avoid penalties.
15. Traceability and Quality Metrics (Defect Rate, Grade Share)
What it is: Share of output meeting specified quality grades and traceability coverage across batches.
How to affect it: Implement lot tracking, standardize grading, improve handling to reduce defects, and invest in lab testing to ensure consistent quality and claims in the market.

Making Metrics Actionable
Metrics are useful only when they drive decisions. Best practice: choose a compact dashboard of 8–12 leading and lagging indicators that link agronomy to finance (e.g., yield, unit cost, post-harvest loss, labour productivity, price realization, gross margin, water use efficiency, and sustainability score). Assign owners, set realistic targets, and run short feedback loops — weekly during season for operations, monthly for finance. Use a mix of remote sensing, in-field sensors, and good old farm diaries to populate metrics. Finally, treat improvement as both technical (inputs, machinery) and managerial (planning, contracts, incentives).
Tracking the right set of agribusiness metrics gives clarity: you’ll see whether you need to chase yield, cut costs, win better prices, or reduce losses. The smart players blend agronomy, data and market strategy; the result is more resilient margins and predictable growth.