College Ranking Analysis Dashboard
The College Ranking Analysis Dashboard shows many diverse capabilities and industries InetSoft offers with its intuitive business intelligence solution since 1996. Focusing primarily on the user, the interactive dashboard is powerful, yet simple enough for users to navigate and enjoy the capabilities of InetSoft's full-fledged software.
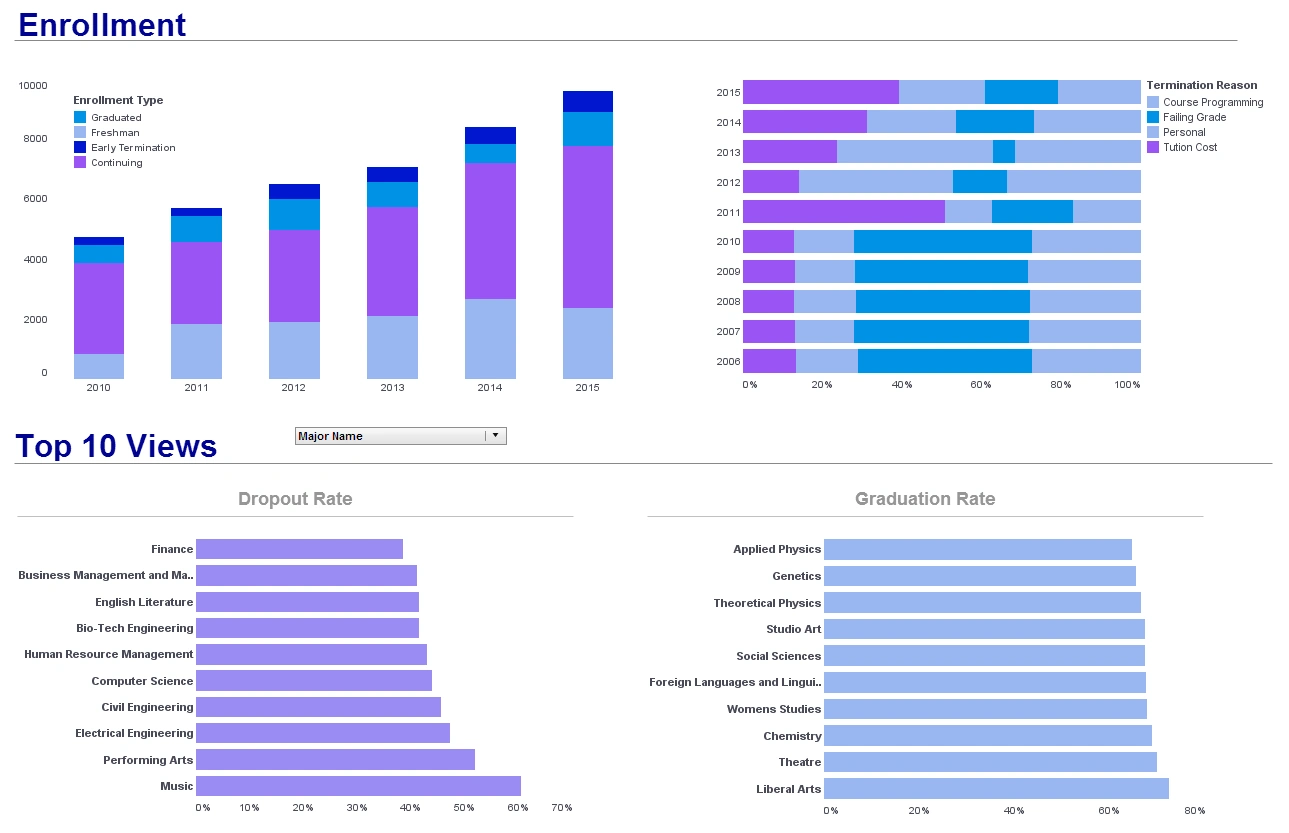
The chart shows the in-depth nature of how information is displayed for a set of distinct data. Simple-to-use, the dashboard presents users with two different types of metric systems along with a scatterplot and a detailed chart of school rankings. InetSoft's data mashup technology, Data Block, allows users to pull data from a large set of databases and use them to make comparisons, charts, metrics, and graphs. The overall result of these charts and metrics can then be used to conduct high quality analysis
InetSoft's visualization software combines ease of use with detailed tools and features to help users in day-to-day operations, as well as help them keep track of real-time data to respond quickly to any changes.
Capabilities of the InetSoft's College Ranking Analysis Dashboard:
- User-friendly interface for easy filtering and sorting options
- Interactive data mashup for quick and effective analysis
- Email, import, export, and print visual analysis
- Easy multi-tasking to compare charts and graphs while drilling down into details
- View data from multiple sources and formats on one dynamic screen.
- Personalization of views via bookmarks
What Factors Go Into a College Ranking?
College rankings are typically influenced by a variety of factors, with different ranking systems placing emphasis on different criteria. However, several common factors often play a significant role in determining a college's ranking:
-
Academic Reputation: The quality of a college's academic programs, faculty, and research output is a fundamental factor in its ranking. This includes factors such as faculty credentials, student-faculty ratio, graduation rates, and the caliber of academic publications produced by faculty members.
-
Student Selectivity: Admission standards and the competitiveness of the applicant pool are important indicators of a college's quality and reputation. Factors such as acceptance rate, standardized test scores of admitted students, and high school GPA of incoming freshmen often influence rankings.
-
Financial Resources: The financial resources available to a college, including endowment size, research funding, and per-student spending, can impact its ability to attract top faculty, support student activities, and invest in academic programs and facilities.
-
Graduation and Retention Rates: Colleges with high graduation and retention rates are often viewed more favorably in rankings, as these metrics suggest that students are satisfied with their educational experience and are able to successfully complete their degree programs.
-
Alumni Outcomes: The success of a college's graduates in the workforce, as measured by factors such as employment rates, earnings potential, and alumni achievements, can reflect positively on the institution's reputation and contribute to its ranking.
-
Student Experience: Factors related to the overall student experience, including campus culture, extracurricular opportunities, student services, and student satisfaction surveys, may also influence rankings, as they contribute to the overall quality of student life at the college.
-
Academic Resources and Facilities: The availability of academic resources, such as libraries, laboratories, and research centers, as well as the quality of campus facilities, including dormitories, dining halls, and recreational amenities, can impact a college's ranking by enhancing the overall learning environment and student experience.

What Metrics Do Colleges Track for Alumni Outcomes?
Colleges track a variety of metrics to assess alumni outcomes and the success of their graduates in the workforce. Some common metrics include:
-
Employment Rate: This metric measures the percentage of graduates who secure employment within a specified period after graduation. It may include both full-time and part-time employment, as well as employment related to the graduate's field of study.
-
Earnings Potential: Colleges often track the median earnings of their graduates to gauge their financial success in the workforce. This metric may be assessed at different points in time after graduation, such as one year out, five years out, or ten years out.
-
Job Placement: Job placement rates indicate the percentage of graduates who secure jobs in their chosen field or a related field within a certain timeframe after graduation. This metric provides insights into the college's ability to prepare students for careers in their desired fields of study.
-
Graduate School Acceptance: Colleges may track the percentage of graduates who are accepted into graduate or professional school programs after completing their undergraduate degrees. This metric reflects the academic preparedness and competitiveness of the college's graduates in pursuing advanced degrees.
-
Career Advancement: Colleges may assess the percentage of alumni who report receiving promotions or advancing in their careers within a certain timeframe after graduation. This metric indicates the long-term impact of the college's education and preparation on alumni career trajectories.
-
Alumni Satisfaction: Colleges may conduct surveys or interviews with alumni to assess their satisfaction with their college experience and the relevance of their education to their careers. Alumni satisfaction metrics provide valuable feedback for evaluating the effectiveness of the college's programs and support services.
-
Employer Feedback: Colleges may solicit feedback from employers who hire their graduates to assess their performance and readiness for the workforce. Employer feedback can help colleges identify areas for improvement in their curriculum, internship programs, and career services.
-
Alumni Achievements: Colleges may track the professional accomplishments and contributions of their alumni, such as awards, publications, patents, and leadership positions. Alumni achievements serve as indicators of the college's impact on society and the success of its graduates in their respective fields.
