Financial Markets Trading Dashboards
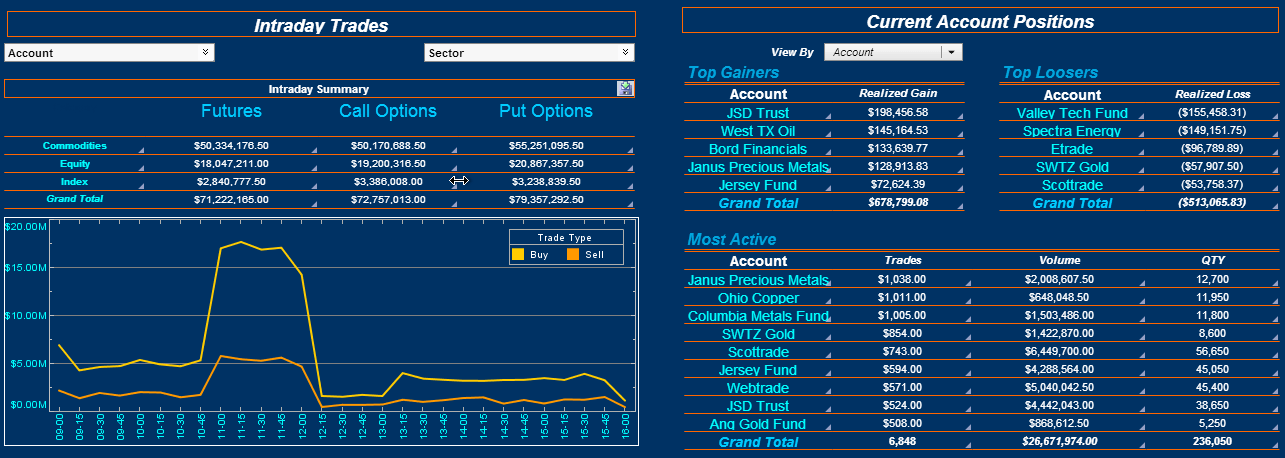
The financial markets trading dashboard to the right is an example of an interactive web-based analytical dashboard constructed using InetSoft's innovative software. A leader in business intelligence solutions, InetSoft enhances and provides organizations of all different sizes with an user-friendly BI software that features unique and powerful tools for everyday business operations.
The chart to the right represents a customizable electronic communication network (ECN), a computerized market maker, that can be used by financial firms to analyze what portions of contracts and transactions are put orders or call orders. With the easy-to-use point and click system implemented in the software, users are empowered with a multitude of features that allows filtering and focus on the different exchanges and/or option types.
InetSoft's visualization software combines ease of use with detailed tools and features to help users in day-to-day decision making, as well as help them be constantly updated in achieving a longer-term goal.

Capabilities of InetSoft's Markets Dashboards
- Monitor, explore, and analyze by filtering and sorting desired information
- Easy to use, modify, and create charts and visuals
- Leverage user-driven data mashup
- Upload and sift through multi-dimensional data to spot trends and aberrations
- Slice and dice data with simple point-and-click method
- Share visual analysis with others
What KPIs and Analytics Are Used on a Forex Trader's Dashboard?
A Forex trader's dashboard typically incorporates key performance indicators (KPIs) and analytics to provide a comprehensive view of market conditions, trading performance, and risk management. Here are some common KPIs and analytics used on a Forex trader's dashboard:
- Account Balance and Equity:
- Current Balance: The total amount of funds in the trading account.
- Equity: The account balance plus or minus any floating profits or losses.
- Profit and Loss (P&L) Metrics:
- Net Profit/Loss: The total profit or loss from all closed trades.
- Daily/Weekly/Monthly P&L: Breakdown of profits or losses over specific timeframes.
- Trade Metrics:
- Number of Trades: The total number of trades executed.
- Winning Percentage: The percentage of trades that resulted in a profit.
- Average Win/Loss Size: The average size of winning and losing trades.
- Risk Management KPIs:
- Risk-Reward Ratio: The ratio of potential profit to potential loss for each trade.
- Maximum Drawdown: The largest peak-to-trough decline in account equity.
- Position Size: The size of each trade position based on risk tolerance.
- Market Analytics:
- Currency Pair Performance: Analyzing the performance of specific currency pairs.
- Volatility Analysis: Monitoring market volatility for informed decision-making.
- Economic Indicators: Incorporating economic indicators that may impact currency markets.
- Technical Analysis Indicators:
- Moving Averages: Tracking trends and potential reversals.
- Relative Strength Index (RSI): Identifying overbought or oversold conditions.
- Bollinger Bands: Indicating potential price volatility.
- Sentiment Analysis:
- Trader Sentiment: Assessing the sentiment of other traders in the market.
- Social Media Analysis: Monitoring social media for market sentiment.
- Trade Execution Metrics:
- Execution Speed: Measuring the speed of trade execution.
- Slippage Analysis: Evaluating the difference between expected and actual trade prices.
- Correlation Analysis:
- Currency Correlations: Examining correlations between different currency pairs.
- Asset Class Correlations: Analyzing correlations with other asset classes.
- News and Events Tracking:
- Economic Calendar Events: Monitoring scheduled economic releases and events.
- News Impact Analysis: Assessing the impact of news on currency pairs.
- Risk Exposure Metrics:
- Currency Exposure: Assessing the exposure to different currencies.
- Portfolio Diversification: Ensuring a diversified portfolio to manage risk.
- Performance Metrics:
- Return on Investment (ROI): Calculating the return on investment over a specific period.
- Risk-Adjusted Return: Adjusting returns based on the level of risk taken.
- Alerts and Notifications:
- Price Alerts: Setting alerts for specific price levels.
- News Alerts: Receiving notifications for important news events.
- Historical Performance Analysis:
- Trade Journal Metrics: Maintaining a trade journal with details of past trades.
- Strategy Backtesting Results: Analyzing the historical performance of trading strategies.
More Articles About Markets Dashboards
Attention Towards Data Warehousing in Capital Markets - We have seen a rapid rise in the level of attention towards data warehousing from capital market firms simply because there is a need for a single source of the truth in regards of the data. And what I mean by that is the single data repository needs to have the most granular, the most voluminous and the most complete and fresh data as well as being enabling an optimal analytical environment...
Capital Markets Business Intelligence - Over the past two decades, the Financial Information eXchange (FIX) Protocol has irreversibly changed the face of Capital Markets. FIX is a real-time industry messaging standard for pre-trade and trade communication in the global equity markets that is quickly expanding into post-trade communication as well as: Foreign exchange, fixed income, and derivatives markets...
Proven ROI in a Matter of Months - In addition, InetSoft software is a unique solution, providing operational intelligence, process awareness, flexible modeling, an action framework, a customizable and empowering end-user interface for a proven ROI in a matter of months. With InetSoft you get an enterprise class solution that's production quality, fault-tolerant and highly available...
Trade Latency KPI - The amount of time it takes for an order to be conveyed, carried out, and verified is known as trade latency. Low latency is essential, particularly for high-frequency trading, where even a few milliseconds may significantly affect earnings. Analysts may find opportunities for trading infrastructure improvement by keeping track of transaction latency...


