Visualize Marketing KPIs and Exploration
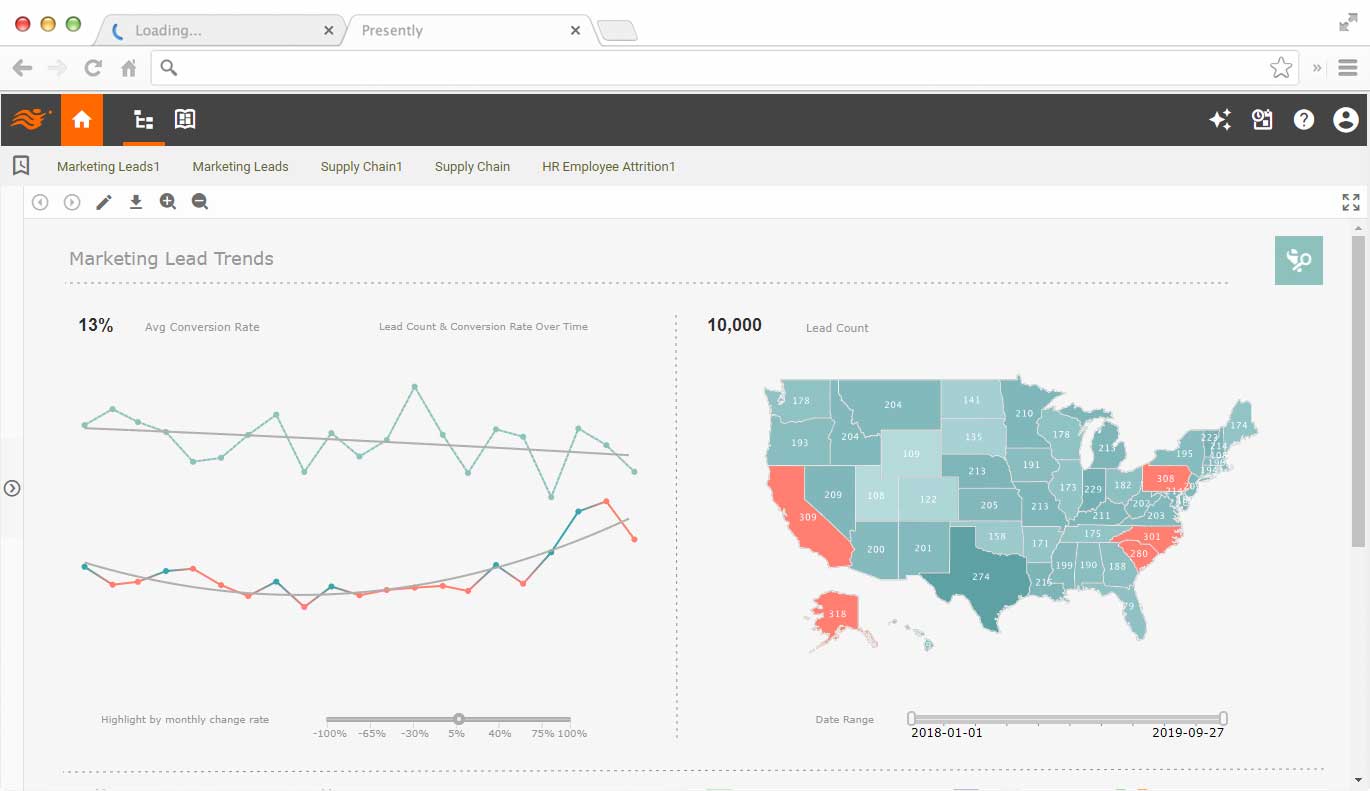
InetSoft's marketing dashboards provide a comprehensive view of key performance indicators (KPIs) and allow for exploration of marketing data. Users can easily drill down into specific metrics and gain insights into campaign performance.
Visualization dashboards allow marketing professionals to easily analyze and refine marketing efforts. InetSoft's visual dashboards offer in-depth built-in interactivity and customization. The marketing team does not need any technical skills to effectively draw information from data.
Self-Service Marketing Data Mashup
Digital marketing is causing a data explosion on multiple fronts. Online search, social media, and traditional channels create a great variety of data. Data formats and granularity levels are also vastly diversified. InetSoft's data mashup-driven web app enables the combination of these data sources to extract maximum marketing value.
Discover Marketing Opportunities Via Machine Learning
Machine learning can take marketing insights to the next level. Algorithms can spot trends and hidden patterns that humans have not noticed. InetSoft's built-in machine learning capability not only brings out machine-discovered intelligence, but it also allows the output to be mashed up with human-designed analysis for comprehensive marketing intelligence.

How the Marketing Department of a Himalayan Salt Miner Uses StyleBI
The marketing department of a Himalayan Salt Mining company faces unique challenges, from promoting specialty salt products to managing seasonal demand fluctuations. Unlike conventional commodities, Himalayan salt is often marketed for its premium culinary, wellness, and decorative uses. As such, understanding customer preferences, market trends, and sales performance is essential for the marketing team to remain competitive. To effectively manage these responsibilities, the company adopted InetSoft’s open-source StyleBI, a powerful business intelligence platform that enables interactive dashboards, real-time analytics, and customized reporting. StyleBI allows the marketing department to visualize key performance indicators (KPIs) and respond to market changes proactively.
One of the core responsibilities of the marketing team is tracking the performance of different product lines. Using StyleBI, they create dynamic dashboards that display metrics such as monthly sales revenue, units sold per product, regional demand variations, and average order value. Bar charts and stacked column charts are commonly used to compare sales figures across product categories, while line charts track trends over time. For instance, a line chart showing monthly sales of pink, black, and white Himalayan salt allows the team to quickly identify seasonal peaks or dips. Additionally, a heat map of regional sales highlights which geographic areas are performing well and which may require targeted marketing campaigns.
Customer engagement is another critical KPI for the marketing department. StyleBI’s dashboards track metrics such as website traffic, social media interactions, and newsletter sign-ups. The team uses pie charts to display the distribution of traffic sources, showing what percentage of visitors come from organic search, social media, email campaigns, or referrals. By analyzing these charts, marketers can determine which channels are most effective for reaching their target audience. For example, if Instagram campaigns result in a higher conversion rate for decorative salt lamps, the department can prioritize visual content for that platform. StyleBI’s ability to blend data from multiple sources ensures that all engagement metrics are available in a single, coherent view.

Lead generation and conversion are also important metrics in this niche industry. The marketing department tracks KPIs such as lead-to-customer conversion rate, cost per lead, and average sales cycle length. Funnel charts in StyleBI visually represent the progression from initial contact to completed sale. By examining the funnel, marketers can identify stages where potential customers drop off and implement targeted interventions. For instance, if many leads fail to convert after requesting product samples, the team may revise follow-up communications or offer incentives to encourage purchase. These insights are critical for maximizing marketing efficiency and ensuring a high return on investment.
Seasonal promotions and campaigns are a major component of Himalayan salt marketing. StyleBI allows the team to monitor the success of these initiatives in real-time. KPI tiles display metrics such as campaign reach, engagement rate, and incremental sales lift. Time-series charts track campaign performance against previous periods, enabling the department to evaluate which strategies yield the best results. For example, a winter wellness promotion may be measured by the increase in online orders of bath salts, while culinary-focused campaigns may track sales of pink salt grinders. StyleBI’s drill-down capabilities allow marketers to view campaign performance at a granular level, such as by individual product, channel, or customer segment.
Inventory management and product availability are closely tied to marketing efforts, as stockouts or overstock can impact promotions and customer satisfaction. StyleBI dashboards incorporate KPIs such as inventory turnover, days of stock on hand, and product backorders. Bar and gauge charts display stock levels by product line and warehouse location, helping marketers coordinate with operations to ensure sufficient supply during peak demand. For instance, if a surge in online orders for Himalayan salt lamps is observed in a specific region, marketing can collaborate with logistics to prevent stockouts and adjust advertising spend accordingly.

Customer feedback and satisfaction are also tracked as part of the department’s KPIs. Surveys, reviews, and social media mentions are analyzed to gauge sentiment toward products and campaigns. Sentiment analysis reports in StyleBI allow marketers to see trends in positive, neutral, and negative feedback. Word clouds highlight frequently mentioned terms, providing insight into product strengths and potential areas for improvement. This information feeds directly into marketing strategies, ensuring that messaging resonates with customer expectations and that products meet quality standards.
Another vital KPI monitored by the marketing team is the effectiveness of pricing strategies. StyleBI enables analysis of average selling price, discount usage, and margin contribution per product. Charts comparing sales volumes and margins help marketers determine the optimal pricing for each product category. For example, a high-volume sale of bulk culinary salt at a lower margin may be balanced against premium pink salt sales with higher margins. This data-driven approach allows the marketing department to maximize revenue while maintaining competitiveness in the specialty salt market.
StyleBI’s reporting features also streamline internal communication and decision-making. Scheduled reports automatically provide weekly or monthly updates to the marketing director and executive team. These reports include interactive charts, tables, and KPI summaries that highlight areas requiring attention. For instance, a report may flag a drop in engagement on a specific social media platform or identify an underperforming product line. This proactive visibility enables managers to act quickly, adjusting marketing campaigns or reallocating resources to maximize impact.

Finally, StyleBI supports predictive analytics and scenario modeling, which the marketing department uses to forecast future sales trends and campaign outcomes. By analyzing historical sales data, customer behavior, and seasonal patterns, the team can simulate different marketing scenarios and predict their potential results. For example, the system can project the impact of increasing social media ad spend on sales of Himalayan bath salts during the winter season. These predictive insights allow for more strategic planning and help the department make data-backed decisions that improve overall performance.