Business Intelligence Software That Supports Multiple Data Sources
If you are looking for business intelligence software that supports multiple data sources, InetSoft provides a unified data access layer designed for organizations that need to blend, analyze, and visualize information from many systems without complex ETL. This capability allows teams to connect to databases, cloud platforms, APIs, files, and enterprise applications, all within a single analytics environment.
Why Multi‑Source BI Matters
Modern organizations rely on data scattered across operational systems, cloud services, spreadsheets, and legacy applications. Business intelligence software must unify these sources to deliver accurate dashboards, cross‑system analytics, and real-time visibility. InetSoft’s multi-source access enables teams to combine structured, semi-structured, and streaming data without rebuilding pipelines or duplicating storage.
Types of Supported Data Sources
InetSoft connects to a wide range of data sources, making it easy to build dashboards and analytics from any system:
- Relational Databases — SQL Server, Oracle, MySQL, PostgreSQL
- Cloud Platforms — AWS, Azure, Google Cloud
- APIs & Web Services — REST, SOAP, JSON feeds
- Files & Spreadsheets — CSV, Excel, XML
- Enterprise Applications — ERP, CRM, HRIS
- Big Data & NoSQL — Hadoop, MongoDB, Cassandra
How InetSoft Handles Multiple Data Sources
InetSoft’s unified data access layer allows users to connect, blend, and analyze data without writing code or performing manual ETL. The platform automatically harmonizes schemas, resolves relationships, and enables real-time mashups across cloud and on-prem systems.
- Connect to any source using built-in connectors
- Blend data visually without ETL
- Model relationships using drag-and-drop tools
- Analyze with interactive dashboards
- Share governed insights across teams
Comparing Multi‑Source BI Options
Many BI tools support multiple data sources, but they differ in flexibility, governance, and integration depth. Below is a comparison of common platforms using row and col formatting.
InetSoft
Unified data access, real-time blending, enterprise governance, interactive analytics.
Tableau
Strong visualization, limited blending without prep tools.
Power BI
Broad connectors, heavy reliance on modeling and DAX.
Looker
Semantic modeling, cloud-first, requires LookML for customization.
Qlik
Associative engine, strong in-memory blending, complex governance.
Why InetSoft Is the Best Place to Get Multi‑Source BI Software
InetSoft stands out because it combines multi-source connectivity with full analytics capabilities, allowing teams to build dashboards, reports, and interactive visualizations from any system. The platform supports real-time blending, governed sharing, and enterprise-grade security, making it ideal for organizations that need flexible, scalable BI.
With more than two decades of experience delivering data access and analytics solutions, InetSoft provides a reliable foundation for cross-system reporting, operational dashboards, and advanced analytics.
Frequently Asked Questions
Where can I get business intelligence software that supports multiple data sources?
You can get BI software with multi-source support from InetSoft, which provides connectors for databases, cloud platforms, APIs, files, and enterprise applications.
Does InetSoft support cloud and on-prem data sources?
Yes. InetSoft connects to hybrid and multi-cloud environments, allowing unified dashboards across all systems.
Can I blend data from different systems without ETL?
InetSoft’s visual mashup engine allows real-time blending without manual ETL or scripting.
What types of data sources does InetSoft connect to?
Databases, cloud services, APIs, spreadsheets, enterprise applications, and big data platforms.
How does InetSoft compare to other BI tools?
InetSoft offers deeper multi-source blending and governance than most visualization-first BI tools.
Access and Mash Up These Data Sources
The list of operational databases, data sources, data warehouses and enterprise applications that InetSoft's BI server can simultaneously access includes:
- Relational databases such as Oracle, SQL Server, PostgreSQL, and MySQL via a JDBC driver
- Multidimensional databases
- Hadoop/HIVE
- XML
- SOAP
- Flat files (CSV)
- Microsoft Excel spreadsheets
- OLAP cubes such as Microsoft SQL Server Analysis Services, Hyperion ESSbase, Oracle OLAP, and SAP NetWeaver
- SAP Business Information Warehouse (SAP BW)
- Progress
- PeopleSoft
- JD Edwards
- salesforce.com
- Siebel CRM
- Google Ads
- Google Analytics
- Microsoft SharePoint
- 42Matters
- Actian Vectorwise
- ActiveCampaign
- Adobe Analytics
- AirTable
- Airtable Dashboard
- Amazon Aurora
- Amazon Redshift
- Apache Cassandra
- Apache Spark
- App Annie
- appFigures
- Asana
- Ask Nicely
- Baan
- Infor
- Bitly
- box
- Buffer
- Campaign Monitor
- Chargebee
- Chargify
- ChartMogul
- Cloudera
- Copper
- CSV
- Data.Gov
- Data.world
- Derby
- EMC
- Greenplum
- FileMaker
- Firebird
- Flat files
- FreshBooks
- Freshdesk
- Freshsales
- Freshservice
- Fusebill
- Google AdSense
- Google AdWords
- Google Analytics
- Google Analytics
- Google Calendar
- Google Search Console
- Google Sheets
- GoSquared
- Hadoop/HIVE
- Harvest Help Scout
- HP Vertica
- Hubspot
- Hyperion
- ESSbase
- IBM DB2
- IBM
- Netezza
- Informix
- Infusionsoft
- Ingres
- Insightly
- Intervals
- Intuit QuickBooks
- Java beans (POJO)
- JDBC
- Jira
- Keen
- Kissmetrics
- Lighthouse
- LiveAgent
- Mailchimp
- MapR
- Microsoft Access
- Microsoft Excel
- Microsoft SharePoint
- Microsoft SQL Server
- Microsoft SQL Server Analysis Services
- monday.com
- MongoDB
- MySQL
- New Relic
- Nicereply
- OData
- ODBC
- Optimizely
- Oracle
- Oracle Hyperion
- Oracle
- JD Edwards
- Oracle OBIEE
- Oracle PeopleSoft
- ParAccel
- ParStream
- Pervasive
- Pipedrive
- PipelineDeals
- PostgreSQL
- Progress
- Prometheus
- QuickBooks Online
- QuickBooks Payments
- Recurly REST
- Salesforce
- Salesforce Reports
- salesforce.com
- SAP ERP
- SAP HANA
- SAP NetWeaver
- SAP NetWeaver Business Warehouse
- SAP SQL Anywhere
- Sendible
- SEOmonitor
- ServiceNow
- Siebel CRM
- Smartsheet
- SOAP
- SparkPost
- SQLite
- Stripe
- Survey Monkey
- SurveyGizmo
- Sybase ASE
- Teradata
- Toggl
- Twilio
- Twilio SendGrid Web Services
- Wistia
- WordPress
- XML
- YouTube
- Zapier
- Zendesk
- Zendesk Sell
- Zoho CRM

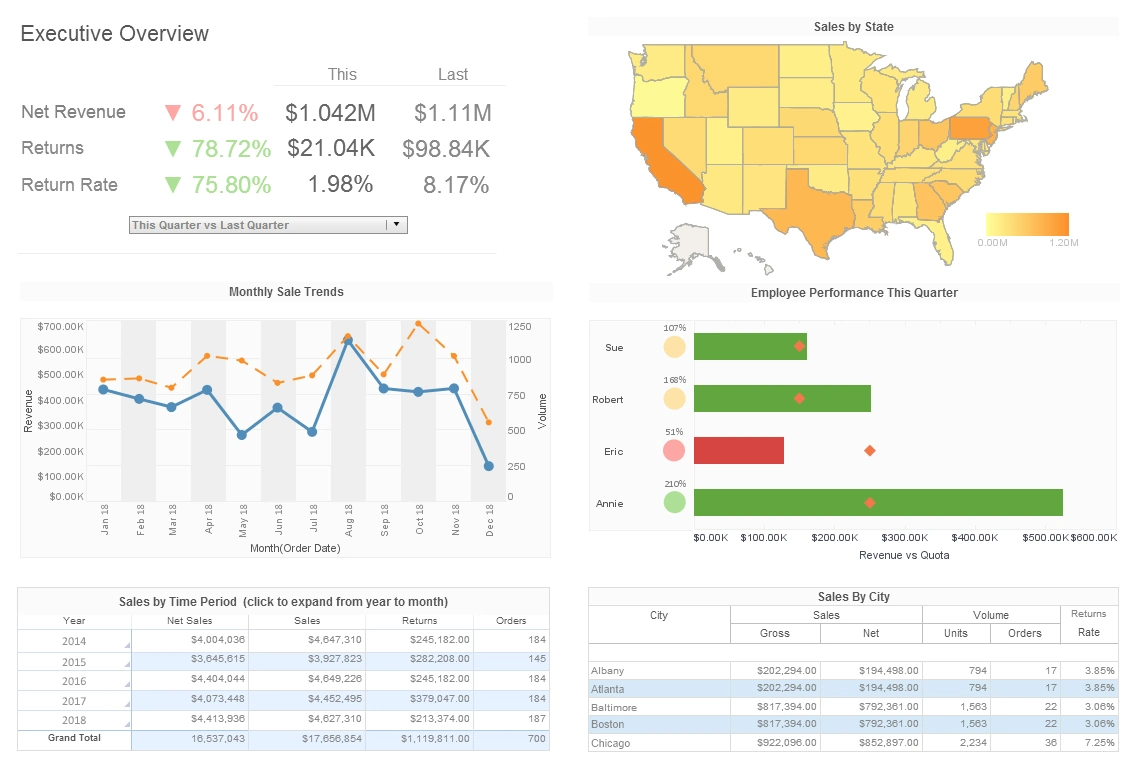
Easy-to-Use, Visually Compelling Dashboards and Reports
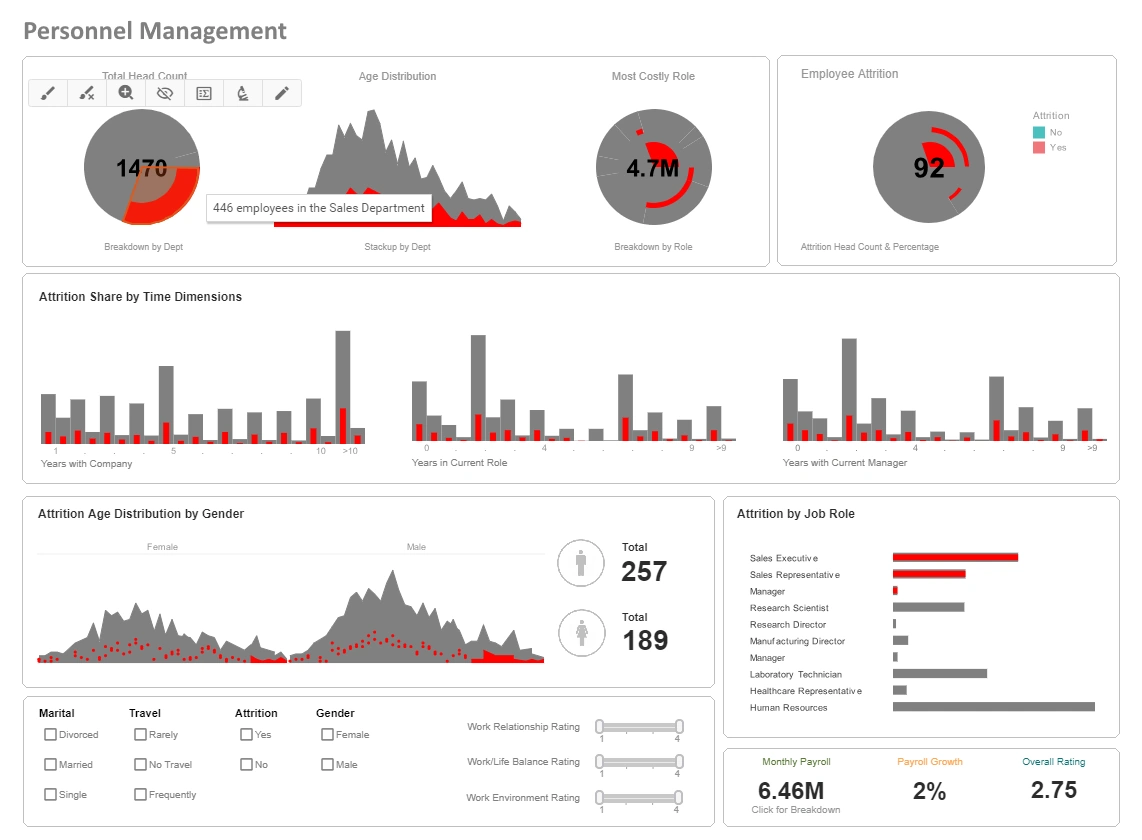
Key to a successful deployment is high adoption and usage, and a key ingredient to that end is offering engaging Flash-based interactive dashboards with simple point-and-click usage. Make it simple enough that little or no training is necessary. Make it highly interactive so gigabytes of data can be explored from a single view for two benefits:
- avoid overwhelming users by saving them from having to search through hundreds of static reports
- cut down on ad hoc reporting requests that a DBA needs to serve
When you analyze your options for a BI solution, you will find these advantages from InetSoft:
- greater agility and ease of use,
- more rapid deployment times
- more flexible and affordable pricing
StyleBI is a small-footprint Java-based business intelligence server that enables rapid development and deployment of monitoring and analytical dashboards such as these.
Powerful Enterprise Data Mashups
A key strength of InetSoft's business intelligence software is its depth of support for data mashups. Data from any of the sources listed above can be combined in productive ways to gain new insights and streamline information consumption.
In addition, InetSoft has innovated unique capabilities for enterprise mashups. You do not have to be a BI analyst to create your own mashups. You can combine disparate tables and fields that were not previously mapped in a data model. Beyond that, you can also bring in your own data sets such as those in personal spreadsheets or those generated by vendors or partners. Whatever dashboards or reports you make from them are now shareable inside the enterprise BI space.
So whether your goal is increasing access to information in your organization or embedding dashboards into your on-premise or SaaS application, evaluate InetSoft's dashboards and reporting software for its ease of use and deployment, agility, and robustness.
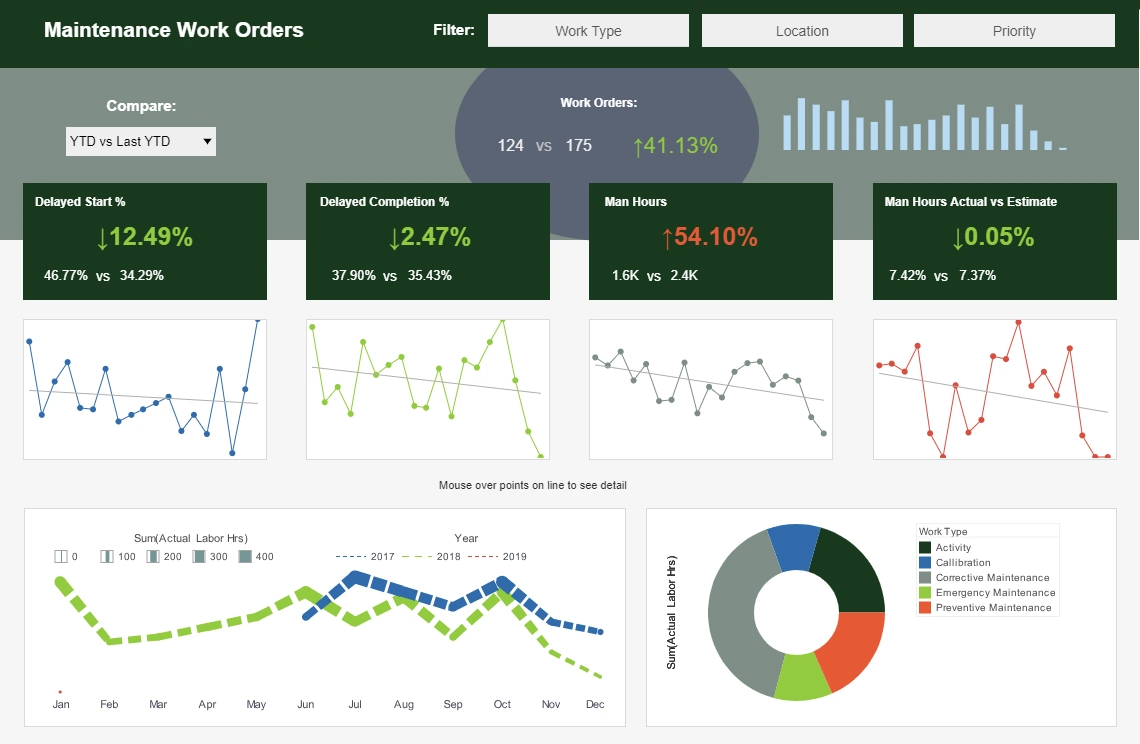
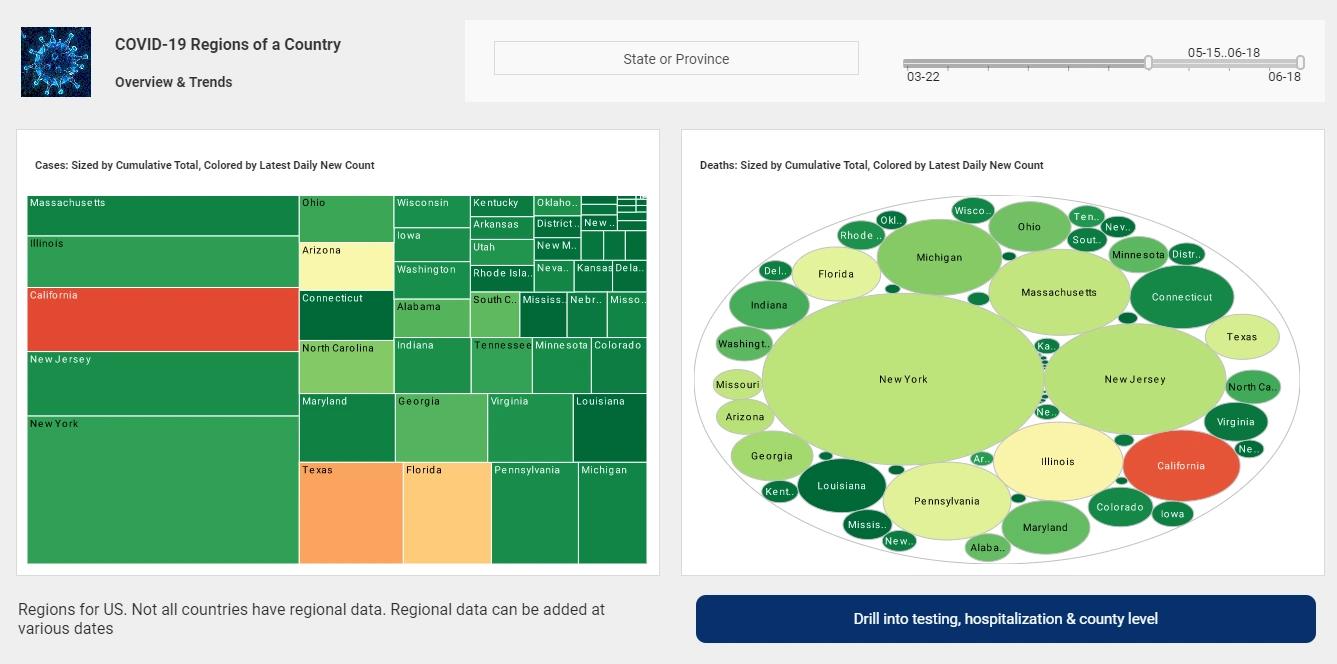

InetSoft Articles About Different Data Dashboards
-
Evaluate InetSoft's Dashboard Data Transformation Tool
This article discusses how InetSoft's StyleBI platform connects to a variety of data sources, including relational databases, spreadsheets, web APIs, cloud platforms, and big data systems. It highlights the platform's ability to perform data transformations and create interactive dashboards without requiring a centralized data warehouse. The piece emphasizes the flexibility and scalability of InetSoft's tools in handling diverse data integration needs. Businesses can leverage these capabilities to streamline their data workflows and enhance decision-making processes.
-
InetSoft's Tools for Live Database Dashboards
Explore InetSoft's real-time data connectors that allow dashboards to pull the most current data from various sources such as REST APIs, JDBC-compliant databases, NoSQL systems, and cloud services like Google BigQuery or AWS. The article emphasizes the importance of live data feeds in scenarios like IoT device monitoring, financial market tracking, or logistics management. It showcases how InetSoft's platform ensures that information displayed is always up-to-date, enabling timely decision-making. The piece also highlights the seamless integration of these connectors into InetSoft's dashboard solutions.
-
Accessing Data Sources as a Web Service
Learn how InetSoft's web-based BI software can access almost any data source, including web and XML feeds or API-based data sources. The article discusses the flexibility of InetSoft's platform in integrating with diverse data sources to provide comprehensive analytics. It highlights the importance of this capability in today's data-driven business environment. Businesses can utilize these features to enhance their reporting and analytical capabilities.
-
Database Dashboard Examples
This article showcases various examples of database dashboards that integrate data from company databases as well as external sources. It discusses how dashboards can represent data in visually appealing formats, aiding in decision-making processes. The piece emphasizes the importance of choosing the correct dashboard style to effectively present data. It provides insights into how businesses can utilize database dashboards to monitor and analyze their operations.
-
InetSoft Product Information: Digital Dashboard Software
Discover how InetSoft's digital dashboard software connects to various big data sources and integrates with R machine learning models. The article discusses the platform's capabilities in transforming and visualizing data, providing interactive dashboards for users. It highlights the ease of use and customization options available within InetSoft's dashboard solutions. Businesses can leverage these features to create tailored dashboards that meet their specific needs.
-
Dashboard Data Assets
Explore how InetSoft's dashboard software provides users with a sophisticated array of data assets for a personalized interactive data experience. The article discusses the platform's ability to connect to various data sources and transform data for visualization. It emphasizes the importance of minimizing data movement to enhance performance. Businesses can utilize these features to create efficient and effective dashboards.
-
Dashboard App with Data Pipeline
Learn how to connect data sources such as databases, APIs, spreadsheets, and cloud applications to build a comprehensive dashboard application. The article outlines the steps to set up automated data cleaning, transformation, and scheduling. It highlights the drag-and-drop tools and built-in templates available for designing dashboards. Businesses can use these capabilities to streamline their data workflows and enhance their dashboard applications.
-
Live Data Dashboards
This article discusses how InetSoft's platform supports live data dashboards that provide real-time insights into business operations. It highlights the use of semantic layers and data modelers to connect to various data sources and create dynamic visualizations. The piece emphasizes the importance of real-time data in making informed decisions. Businesses can leverage these features to monitor and analyze their operations in real-time.
-
Portal Dashboards | InetSoft Product Features & Benefits
Explore how InetSoft's portal dashboards integrate real-time or near-real-time data from various sources such as customer support tickets, call center interactions, live chat sessions, social media mentions, and customer satisfaction surveys. The article discusses the customization options available for presenting specific metrics relevant to an organization's goals. It highlights the benefits of using portal dashboards to monitor and analyze customer service performance. Businesses can utilize these dashboards to enhance their customer service operations.
-
Data Integration Software to Access Multiple Data Sources
Learn how InetSoft's software supports various data sources, including relational databases, XML, SOAP, flat files, and custom sources, with a flexible API. The article discusses how StyleBI interfaces with these data sources and solves integration problems that other dashboard or reporting tools may not address. It emphasizes the plat